Fig. 7.
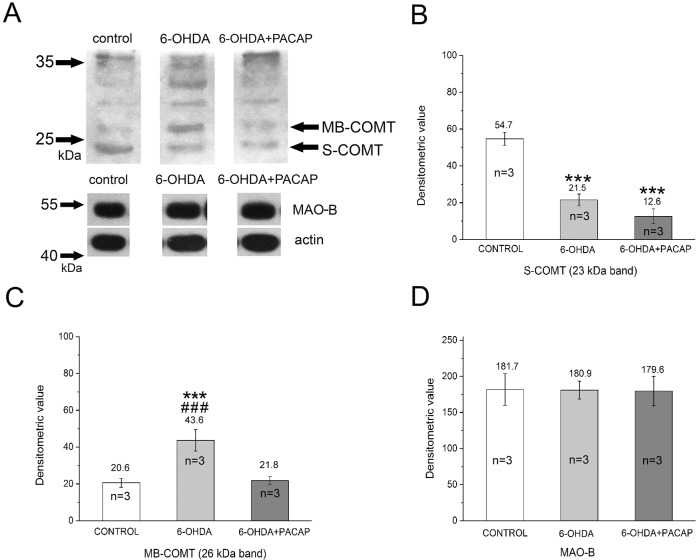
Analysis of DA metabolic enzymes in rat SN after treatment with 6-OHDA. (A) S- and MB-COMT at 23 and 26 kDa in control, 6-OHDA and 6-OHDA+PACAP groups are represented. Middle row shows the intensity of MAO-B. Anti-β-actin was used as an internal control (lower row). MAO-B (middle) and β-actin (bottom) levels were similar in all groups. Changes in concentration of S-COMT (B), MB-COMT (C) and MAO-B (D) detected by densitometry were identified at 23 kDa, 26 kDa and 55 kDa, respectively (n=3, calculated from independent WB experiments). S-COMT: F(2)=108.09; P<0.001; post hoc test between control and 6-OHDA groups (P<0.001), control and 6-OHDA+PACAP groups (P<0.001). MB-COMT: F(2)=134.42; P<0.001; post hoc test between control and 6-OHDA (P<0.001), 6-OHDA and 6-OHDA+PACAP groups (P<0.001). ***P<0.001 between control and treated groups; ###P<0.001 between 6-OHDA and 6-OHDA+PACAP groups.

