Fig. 2.
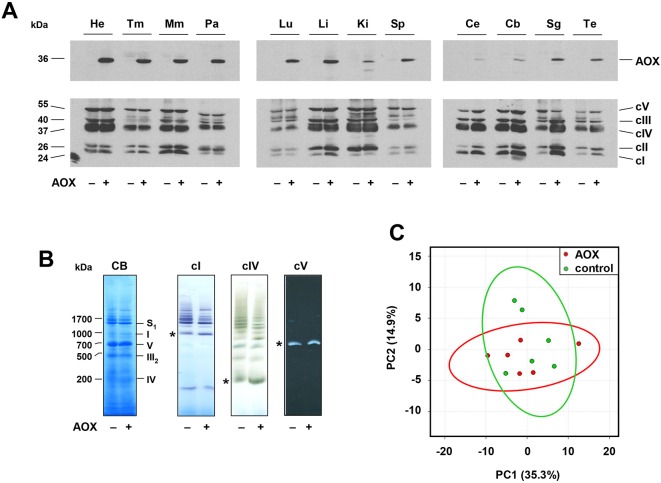
AOXRosa26 mice show broad AOX expression and normal metabolism. (A) Western blots of 20 μg total protein extracts from the indicated tissues (He, heart; Tm, thigh muscle; Mm, masseter muscle; Pa, pancreas; Lu, lung; Li, liver; Ki, kidney; Sp, spleen; Ce, cerebrum; Cb, cerebellum; Sg, salivary gland; Te, testis) of 54-week-old male hemizygous AOXRosa26 (+) and wild-type littermate control (–) mice, probed for AOX and for representative subunits of the five OXPHOS complexes (see Materials and Methods, protein molecular weights extrapolated from markers). For Ponceau S staining of the membranes see Fig. S2B. See also Fig. S2A,C,D. (B) BNE gels of mitochondrial membrane proteins from hemizygous AOXRosa26 (+) and wild-type littermate control (–) mice, stained with Coomassie Blue (CB) or probed by in-gel histochemistry for the indicated OXPHOS complexes. * denotes the migration of the respective monomeric complexes. Assignment of mitochondrial complexes (I, cI; III2, dimeric cIII; IV, cIV; V, cV; S1, respiratory supercomplexes containing cI, dimeric cIII and one copy of cIV) is based on protein molecular weights extrapolated from the migration of the complexes from bovine heart mitochondria, whose subunit composition is known. (C) Principal component analysis of metabolome data from skeletal muscle of hemizygous AOXRosa26 (red circles) and wild-type littermate control mice (green circles). The two sets of analysed data overlap, apart from two minor outliers from the control group. See also Fig. S2H.

