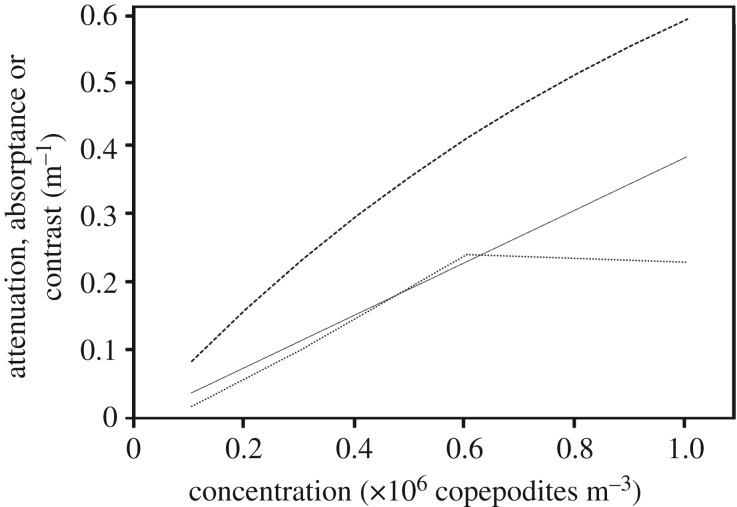
Figure 2.
Light absorption and visual contrast of living fifth copepodites of Calanus finmarchicus in seawater. Dotted curve: attenuation versus concentration (averages of the attenuation spectra electronic supplementary material, figure S1). Thin straight line: linear fit to average concentration data (through a concentration of 0.6 copepodites m−3) forced to pass through the origin y = 0.0386x. Dashed curve: absorptance (proportion of light removed) corresponding to the fitted curve, which is identical to the Weber contrast of copepod patches viewed at very short distances over this range of concentrations.

