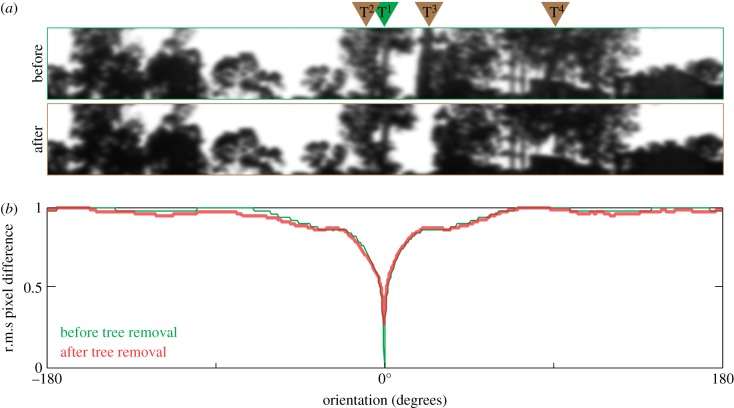
Figure 2.
Quantifying the change in the landmark panorama after three trees were removed. (a) Panoramic view before the trees were removed (upper) and after the trees were removed (lower). Green arrow indicates the direction of the foraging tree T1; brown arrows indicate the trees T2, T3 and T4 that were removed. Panoramic images were low-pass filtered with a σ = 3° Gaussian filter to match the visual acuity of the ants. (b) The rotIDF compares the view before the trees were removed with itself (green) and compares views before and after the trees were removed (red). Both curves have a distinct minimum that points in the direction of the foraging tree (0°).

