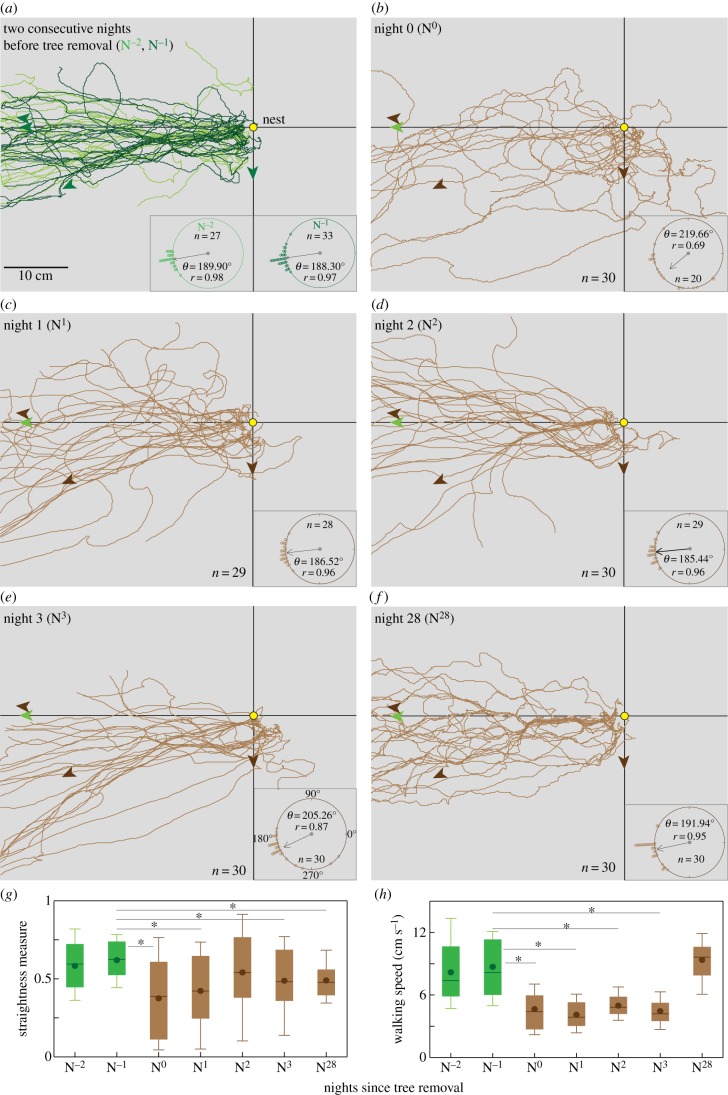
Figure 3.
Initial foraging paths of ants before and after the trees were removed. Paths of ants on (a) two consecutive nights before the trees were removed and after the trees were removed on (b) N0, (c) N1, (d) N2 (e) N3 and (f) N28. Nest (yellow circle), direction from the nest towards the trees before removal (green) and after removal (brown) are shown by arrows. Inset in each panel: circular plot shows the orientation of the ants at a path length of 10 cm (foraging tree direction = 180°). Ants that did not travel more than 10 cm were excluded from this analysis. Mean vector (θ), length of the home vector (r) and sample size (n) are shown. Box plots show (g) path straightness and (h) walking speed. Straightness is defined as the ratio between the path length and the straight line distance to the nest. Box plot shows mean (filled circle), median (thick line) and 25th and 75th percentile and whiskers extend to 10th and 90th percentile. Green: before the trees were removed; brown: after the trees were removed. *p < 0.001.

