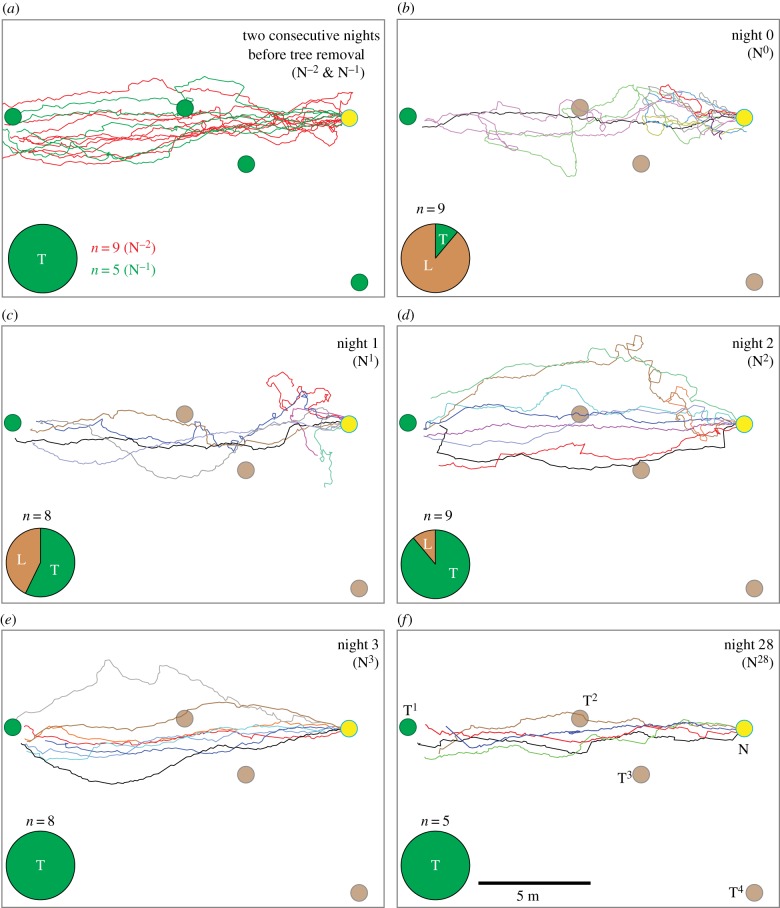
Figure 4.
Paths of ants recorded with a DGPS before and after the trees were removed. Paths of ants on (a) two consecutive nights before the trees were removed and after the trees were removed on (b) N0, (c) N1, (d) N2 (e) N3 and (f) N28. Pie-graph insets show the proportion of animals that successfully reached and climbed the tree (T, in green) and those that were lost (L, in brown). On N0 (b), only one ant reached the tree (in black) and two others that travelled close to the tree returned back to the nest (in green and purple). Paths are shown in different colours to distinguish the paths. Other conventions as in figure 3.

