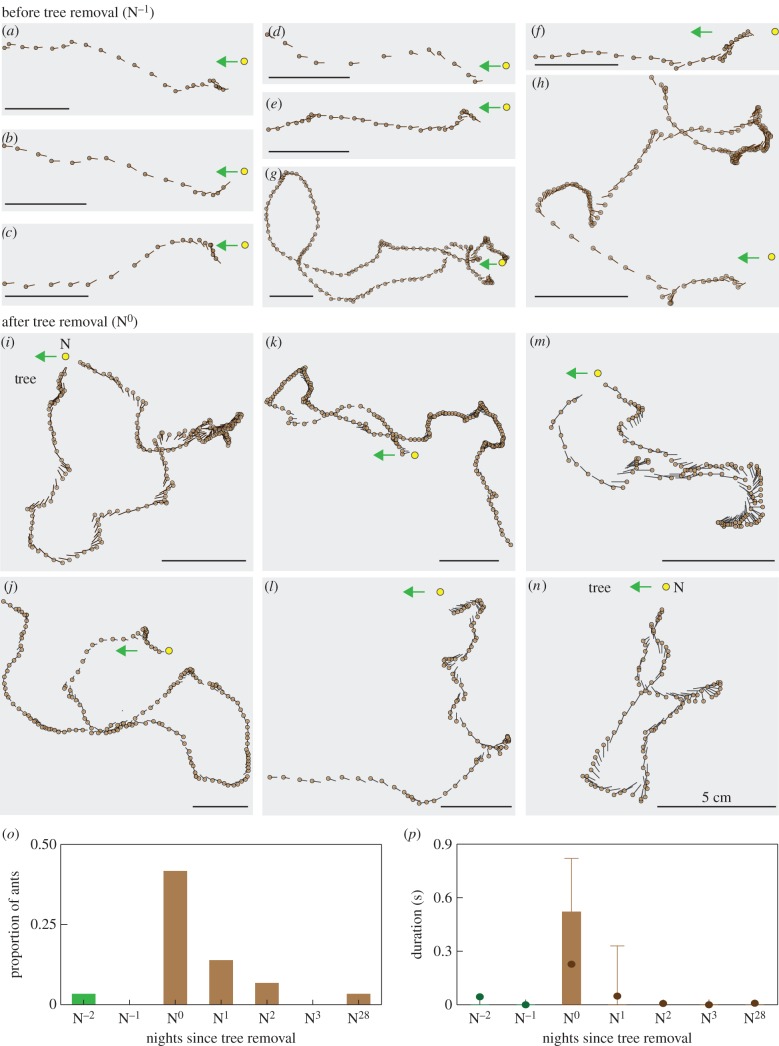
Figure 5.
Gaze direction of ants before and after tree removal. Quiver plots show gaze direction (line) with head position (brown circle) of ants on nights (a–h) before the trees were removed and (i–n) after the trees were removed. Ants were filmed at 20 ms interval, but for clarity data are displayed at a 100 ms interval. Nest (yellow circle, N) and the direction of the foraging tree (green arrow) are shown. Scale bar is 5 cm. (g,h) The only two ants, before tree felling, that turned back and looked in the direction of the nest. (o) Histogram showing the proportion of ants that turned back to look towards ±10° of the nest. (p) Box plot shows the duration that ants viewed ±10° of the nest. Sample size for panels o and p as indicated in figure 3. The ground was sloping into the nest entrance for 1–3 cm around the entrance. We tracked ants away from this region and hence the paths do not always start from the nest.

