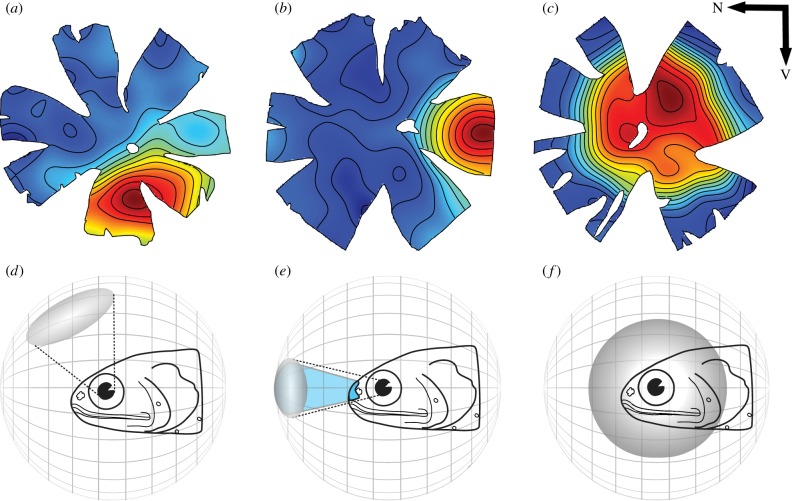
Figure 2.
The three types of retinal specializations (a–c) found in lanternfishes and their corresponding ecological significance (d–f). (a–c) Topographic maps of ganglion cell densities: (a) elongated area ventrotemporalis, (b) area temporalis, (c) large area centralis. The colour gradient on the maps is similar to the one in figure 1, with red representing high cell densities and blue low cell densities. N, Nasal; V, ventral. Adapted from [33] with the permission of S. Karger AG, Basel. Panels (d–f) illustrate the visual significance of each topography (a–c), respectively. The shaded grey areas represent the regions of the visual field subtended by the retinal specializations (high density of ganglion cells represented in red to light blue on the maps). In (e), the lanternfish possesses a large head luminous organ that may emit light in front of the fish (in blue).

