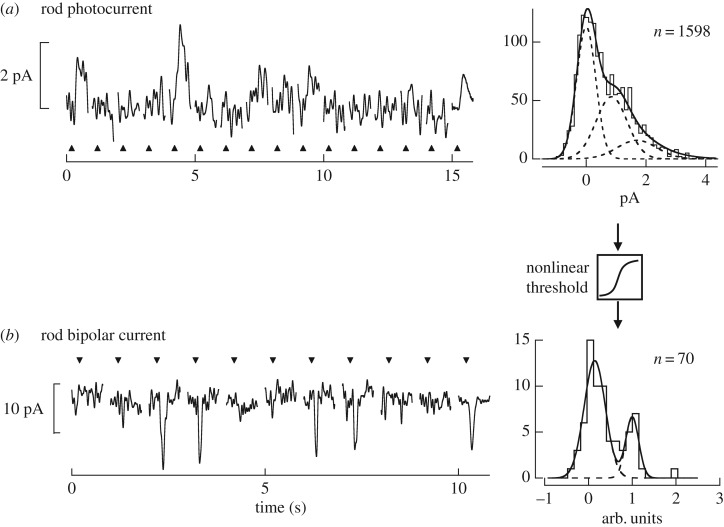
Figure 3.
(a) The response of a rod photoreceptor held in a suction electrode to repeated presentations of a dim flash that yield less than one R* per trial. The average response per photon is at the far right. The amplitude of each trial was estimated by their correlation with the average response and plotted in a histogram. The histogram was fit as the sum of Gaussian distributions centred around the average amplitude of the dark noise, the single-photon response and the double-photon response. The areas of each of these distributions were scaled based on the Poisson probability of observing 0, 1 or 2 photons absorbed. Note the region of overlap between the distribution of noise and single-photon responses. (b) Similar analysis was done with rod bipolar cell responses, except those were collected during perforated-patch clamp recordings while holding the membrane potential at −60 mV. The greater signal-to-noise ratio is apparent from the reduced region of overlap in the distributions of noise and single-photon responses. Data are reproduced from Okawa et al. [38].

