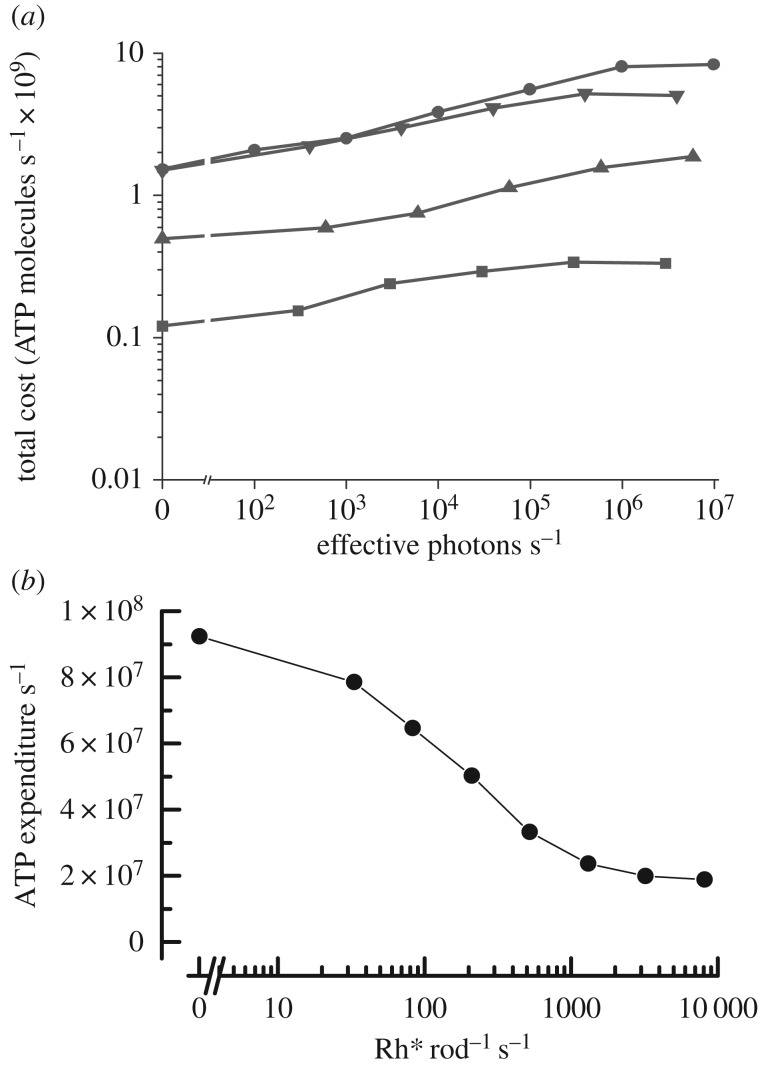
Figure 2.
Comparison of ATP utilization by rhabdomeric and ciliary photoreceptors. (a) Mean rate of hydrolysis of ATP molecules per second calculated from membrane conductance and rate of ion pumping, as a function of rate of photon absorption for R1–6 rhabdomeric photoreceptors from four species of flies: Calliphora vicina (filled circles), Sarcophaga carnaria (filled downside triangles), Drosophila virilis (filled upside triangles), and Drosophila melanogaster (filled squares). (Reprinted with permission from Niven et al. [17]). (b) Mean rate of hydrolysis of ATP molecules per second from all sources. Calculated as a function of photon absorption for mouse ciliary rod photoreceptors. (Adapted and reprinted with permission from Okawa et al. [18]).

