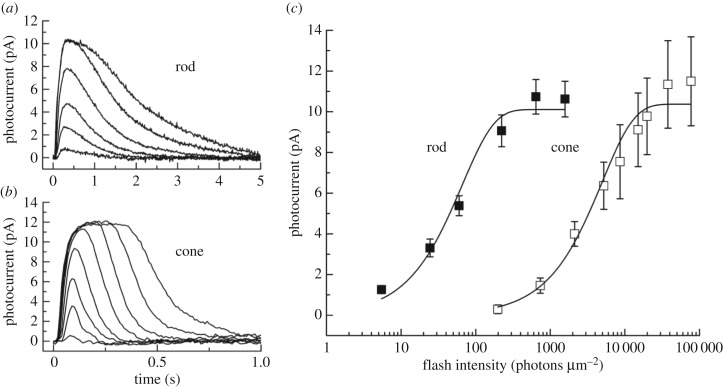
Figure 3.
Current responses and sensitivity of lamprey rod and cone photoreceptors to brief light stimuli. (a) Mean responses of 11 rods to 20 ms, 500 nm flashes given at t = 0 for the following intensities (in photons μm−2): 5, 24, 60, 222, 642 and 1576. (b) Mean responses of eight cones to 20 ms, 600 nm flashes given at t = 0 for the following intensities (in photons μm−2): 735, 2120, 5210, 1.98 × 10⁴, 7.70 × 10⁴, 2.28 × 10⁵, 6.96 × 10⁵ and 2.03 × 10⁶. (c) Mean peak current response amplitudes plotted against flash intensity for 11 rods (filled squares) and eight cones (open squares). Error bars are standard errors of the mean. Cells are the same as in (a) and (b). The data for both cell types were fitted with the equation r = rmax [1 − exp(−kI)]. The best-fitting values of rmax and k were 10.1 pA and 1.52 × 10⁻² photons−1 µm2 for rods and 10.4 pA and 2 × 10⁻⁴ photons−1 µm2 for cones. (Reproduced with permission from Morshedian & Fain [23]).

