
Figure 4.
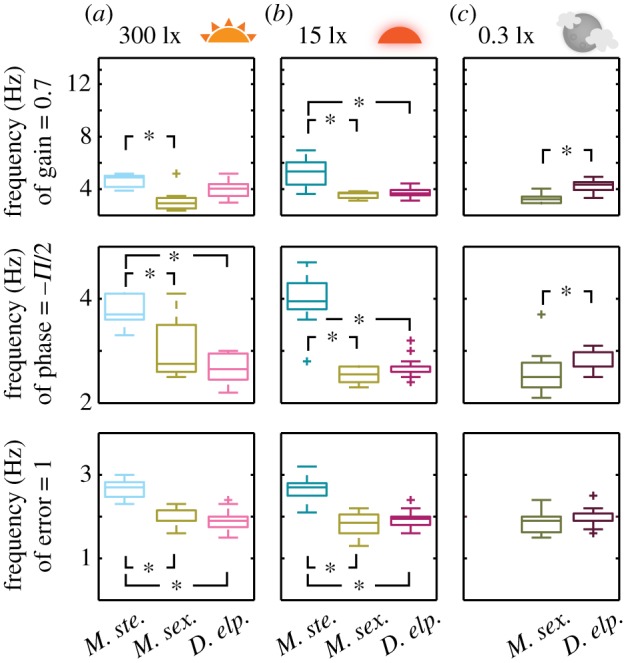
Summary statistics of the flower tracking performance across species. Shown are the frequencies where each species' flower tracking had a gain of 0.71 (50% power), a phase of −π/2 and a tracking error of 1. Box shows interquartile range and median; whiskers denote quartile ± 1.5 × interquartile range. Asterisks denote p < 0.05 (Kruskall–Wallis test).