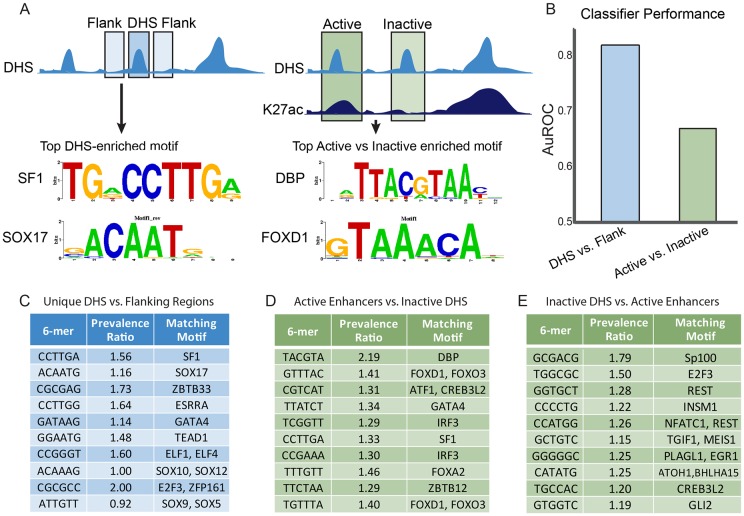
Fig. 4.
TF-binding sites in active enhancers and inactive DHSs. (A) Schematic representation of the classification approach to identify motifs and TFs predictive of Sertoli cell DHSs. The top enriched motifs with known binding factors for sites predictive of DHS versus flank (left) and active versus inactive DHSs (right) are shown. (B) AuROC for different L1-logistic regression classifiers. Classifying active enhancers and inactive DHS against flanking regions shows high classifier performance (∼0.82), while classifying active enhancers against inactive DHS shows lower performance (∼0.67). (C-E) Top motifs driving predictive performance for the different classification tasks. TFs shown are best hits from the MEME suite's TOMTOM tool matching to the different 6-mers (Gupta et al., 2007). The prevalence ratio is defined as: the ratio of the average length normalized frequency of that 6-mer in DHSs unique to Sertoli cells relative to the flanking regions (C); the ratio of the average length normalized frequency of that 6-mer in active enhancers to inactive DHSs (D); the ratio of the average length normalized frequency of that 6-mer in inactive DHSs to active enhancers (E). The top 10 6-mers are shown in order of the absolute value of their regression coefficients. Only the first 6-mer matching to a particular TF is shown. TFs identified in D and E were identified in the same classifier, with those TFs shown in D more highly prevalent in active enhancers and those in E more prevalent in inactive DHSs. Table S3 contains the complete results for the analyses in C-E.

