Fig. 3.
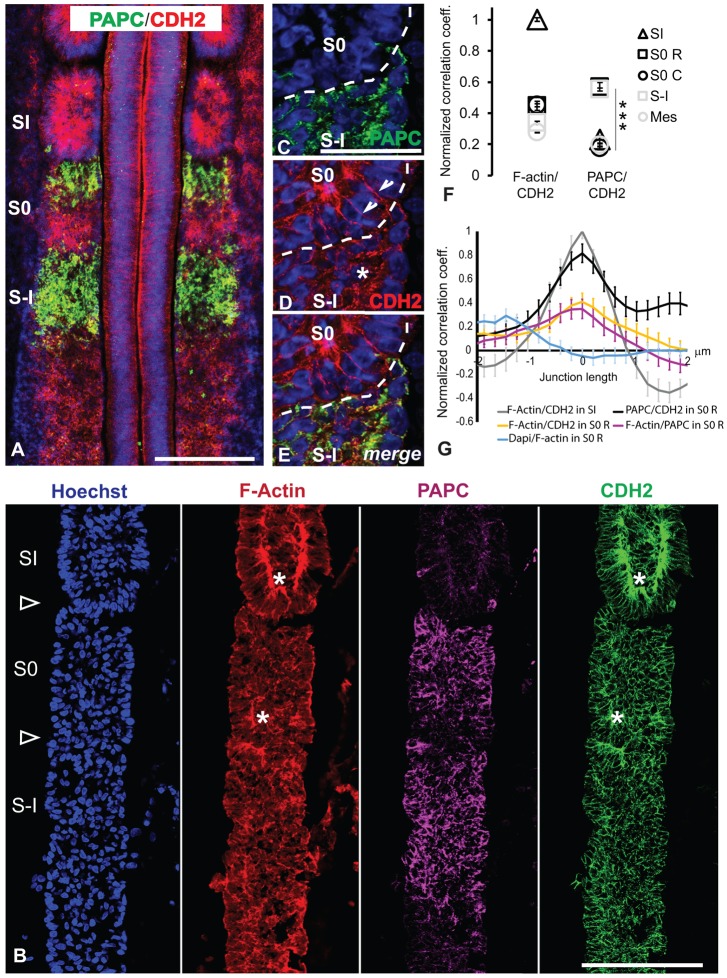
Complementary distribution of PAPC and CDH2 in the forming somite. (A) Comparison of PAPC (green) and CDH2 (red) distribution by immunohistochemistry in the anterior PSM. Nuclei are labeled in blue. Dorsal view, anterior to the top. Scale bar: 200 µm. (B) Confocal images of parasagittal sections of a stage 15 somite chicken embryo PSM stained for nuclei (Hoechst, blue), F-actin (Phalloidin, red), PAPC (magenta) and CDH2 (green). Arrowheads mark somitic boundaries, asterisks mark sites of CDH2 and F-actin epithelial colocalization. Scale bar: 100 µm. (C-E) Confocal images of the interface between somites S0 and S-I, immunostained for PAPC (green) and CDH2 (red). The dashed white line marks the position of the forming boundary. Nuclei are labeled in blue. Scale bar: 50 µm. (F) PAPC, CDH2 and F-actin colocalization analysis in the anterior PSM. Normalized correlation coefficients were calculated based on signal intensity profiles for each staining within each PSM subdomains (n=3 embryos). A value of 1 corresponds to a total positive correlation. C, caudal half; mes, posterior PSM mesenchyme; R, rostral half; S-I/0/I, somite -I/0/I. ***P<0.0005. (G) PAPC, CDH2 and F-actin colocalization analysis at cellular junctions. Normalized correlation coefficients were calculated based on signal intensity profiles along cell-cell junctions in various PSM subdomains (n=20 junctions per domain; R, rostral; S0/I, somite 0/I). A value of 1 corresponds to a total positive correlation, and a peak centered at 0 μm indicates that both signals are colocalized.

