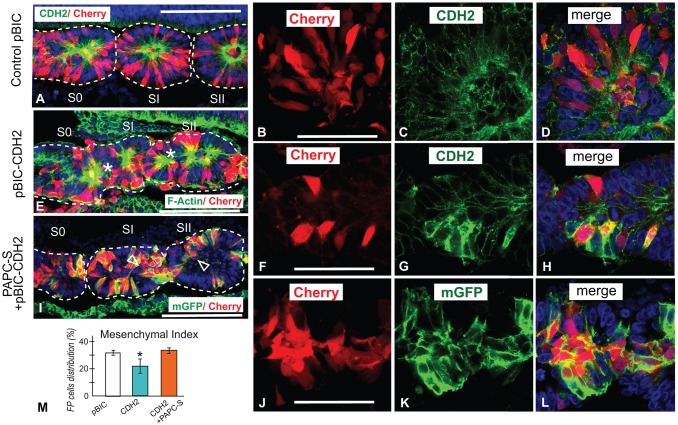
Fig. 5.
PAPC negatively regulates CDH2 during somite morphogenesis. (A-L) Immunostainings of parasagittal sections of E2 chicken embryos PSM electroporated with pBIC (control; A-D; n=10), pBIC-CDH2 (E-H; n=25), or co-electroporated with pBIC-CDH2 and pCImG-PAPC-S (I-L; n=32). Electroporated cells with pBIC vectors co-express mCherry (red), and with pCImG vector co-express membrane-bound GFP (green, I-L). Nuclei are shown in blue in A,E,I and D,H,L. Somite individualization is highlighted by dashed white lines. (A,E,I) Low magnification images. Scale bars: 100 µm. Asterisks in E mark ectopic epithelial rosettes. Arrowheads in I mark contribution to somitocoele. (B-D,F-H,J-L) Higher magnification of parasagittal cryosections of the forming somite region of E2 chicken embryos electroporated with pBIC (B-D), pBIC-CDH2 (F-H) or pBIC-CDH2+pCImG PAPC-S (J-L) showing immunostainings labeled with an anti-Cherry (red, B,F,J), an anti-CDH2 (green, C,G), an anti-mGFP (green, K) and merged panels (D,H,L). Scale bars: 25 µm. (M) Distribution of electroporated fluorescence-positive (FP) cells in the mesenchymal and epithelial domains (mesenchymal index) of the newly formed somites electroporated with pBIC, pBIC-CDH2 or co-electroporated with pBIC-CDH2+pCImG PAPC-S (n>6 per condition). Mean±s.e.m. *P<0.05.

