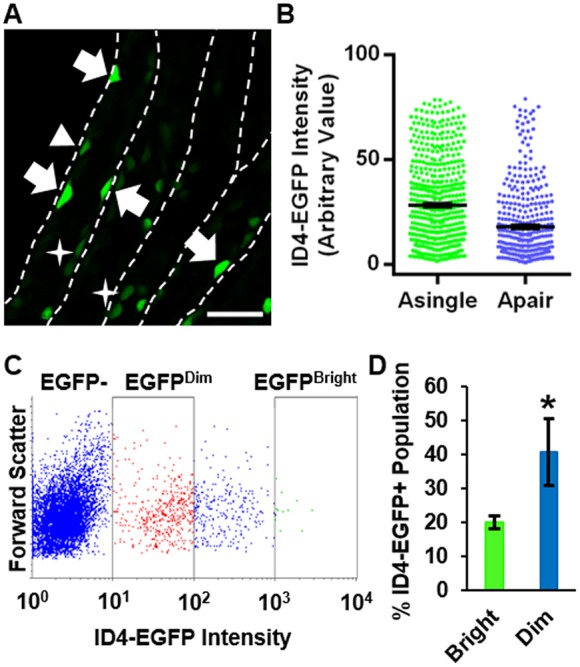
Fig. 1.

Distinction of undifferentiated spermatogonial subsets by ID4-EGFP expression in testes of mice. (A) Whole-mount confocal image of live seminiferous tubules from an Id4-eGfp transgenic mouse at P8. EGFP+ cells are ID4-expressing spermatogonia. Arrows indicate Asingle with bright EGFP intensity (ID4-EGFPBright). Arrowhead indicates Asingle with dim EGFP intensity (ID4-EGFPDim). Stars indicate Apair with dim EGFP intensity (ID4-EGFPDim). Scale bar: 50 µm. (B) Quantitative comparison of EGFP intensity in Asingle and Apair ID4+ spermatogonia. Each dot represents an individual cell (n=4 different animals, 13.2 mm of tubules, 944 total cells) and the mean±s.e.m. is indicated by black bars for each population. (C) Dot plot of flow cytometric analysis (FCA) for subsets of spermatogonia based on ID4-EGFP intensity. (D) Quantitative comparison of the percentage of the ID4-EGFP+ population that can be classified as ID4-EGFPBright or ID4-EGFPDim from FCA. Data are mean±s.e.m. for three independent experiments. *P<0.05.
