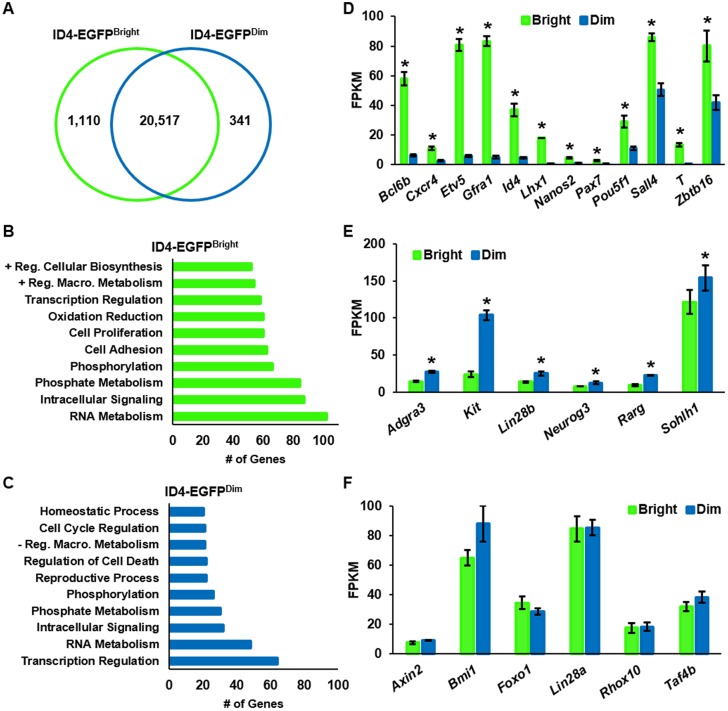
Fig. 3.
Transcriptome distinction of ID4-EGFP+ spermatogonial subsets by RNA-seq. (A) Venn diagram depicting the number of genes determined to be expressed at significantly greater levels in ID4-EGFPBright or ID4-EGFPDim spermatogonial populations at q≤0.01. Data are derived from FACS-isolated populations; n=3. (B,C) Functional classification of genes upregulated in ID4-EGFPBright (B) and ID4-EGFPDim (C) spermatogonia by GO analysis. Data are the number of genes binned into the top ten functional categories for each population. (D,E) Genes with significant (P≤0.05) upregulation in ID4-EGFPBright (D) or ID4-EGFPDim (E) spermatogonia. (F) Genes with no difference (P>0.05) in expression between ID4-EGFPBright and Id4-EGFPDim spermatogonia. For all graphs, data are mean±s.e.m. Fragments per kilobase of exon per million fragments mapped (FPKM) values from RNA-seq analyses of three matched samples from different pools of animals. *P<0.05.

