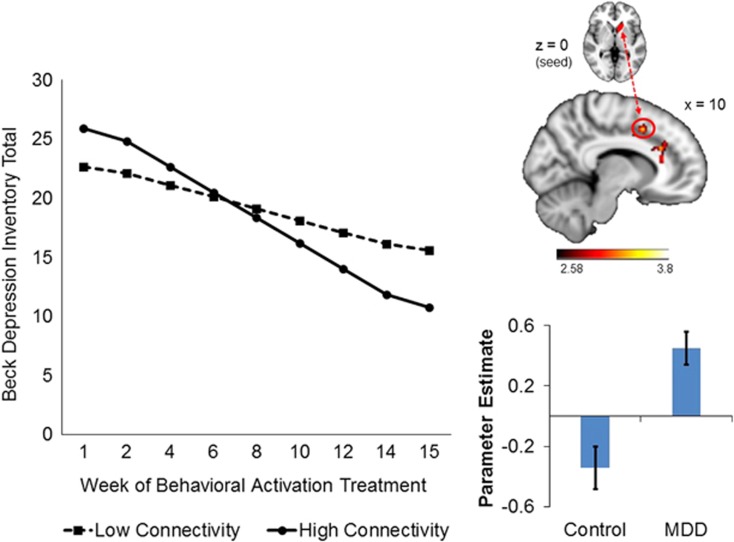
Figure 2.
Within the MDD group, greater global connectivity between the left caudate (seed) and right paracingulate gyrus (BA 24/32) during reward anticipation predicted greater improvement in BDI total scores over the course of BATD treatment. The plot is a graphical illustration of the significant interaction between pretreatment connectivity and time predicting change in BDI scores from the HLM models. The lines represent the expectation for change in an individual who is one SD below the mean and one SD above the mean. Note the lines are model-based estimates and do not represent averages but rather ranges of brain connectivity variability. The brain image indicates the seed region above and the connecting cluster beneath. The bar graph illustrates connectivity estimates. A full color version of this figure is available at the Neuropsychopharmacology journal online.

