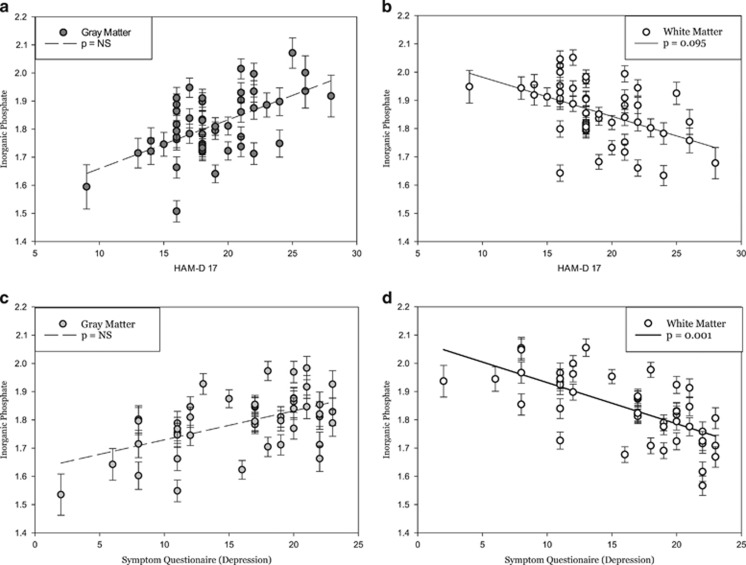
Figure 5.
Least squares means plot of individual subjects (a–b) HAM-D scores and scores on the (c–d) Symptom Questionnaire (depression), which significantly predicted levels of gray matter and white matter inorganic phosphate (Pi) in depressed subjects. (a) Gray matter Pi showed no association to HAMD-17 score (t446=2.40; p=0.164), and (b) white matter Pi showed a significant negative association (t129=−2.63; p=0.095). (c) Analogous to the results from the HAM-D-17, gray matter Pi also showed no association with the SQ (depression) score (t339=2.08; p=0.381), whereas (d) white matter Pi showed a highly significant association to the SQ (depression) score (t120=−3.98; p=0.001).

