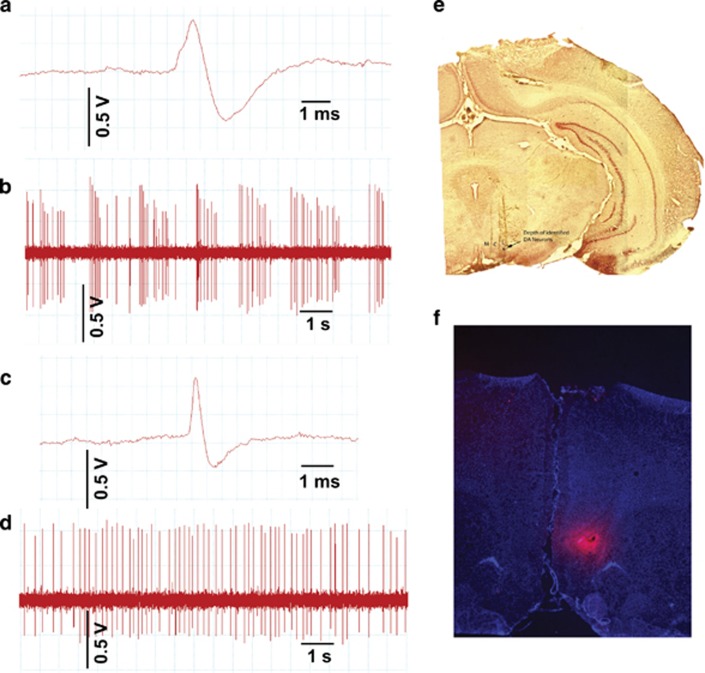
Figure 1.
Dopamine recording procedure and microinfusion diffusion estimate. (a) Sample trace of dopamine neuron recording demonstrating key action potential features including long duration and biphasic ascending phase. (b) Sample recording of ventral tegmental area (VTA) dopamine neuron showing characteristic irregular, slow firing rate, mixed with sporadic periods of burst firing. (c) Sample trace of a neuron identified as non-dopaminergic. Note the short duration action potential. (d) Sample recording of a VTA neuron identified as non-dopaminergic. Note the comparatively more regular firing pattern. (e) Locations of medial (M), central (C), and lateral (L) subregions of VTA. Blue dot in lateral track indicates the depth at which dopamine neurons were found in this animal. (f) Fluorescent microscope image from infusion of fluorescently tagged marker into infralimbic prefrontal cortex (ILPFC) used to estimate diffusion of subsequent drug microinfusions. LHb, lateral habenula.

