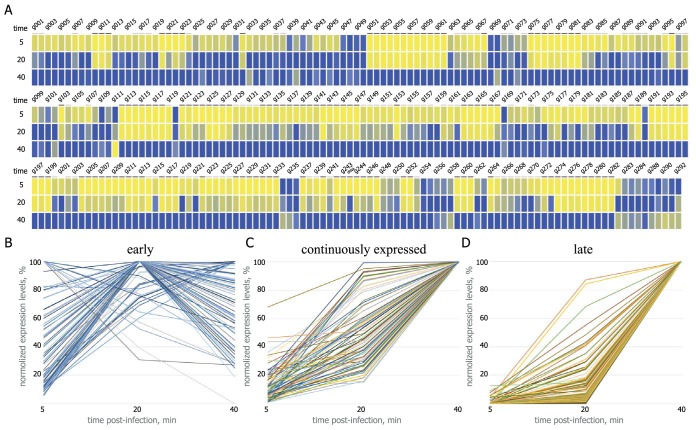
FIG 4 .
Global temporal patterns of AR9 genome transcription. (A) A heat map summarizing the temporal pattern of AR9 transcripts. The normalized expression levels of each AR9 gene across three time points (5, 20, and 40 min postinfection) are color coded blue for high and yellow for low expression levels. Late genes are underlined in dark gray, and continuously expressed genes are underlined in light gray. (B to D) Time courses of accumulation of individual AR9 transcripts (292 ORFs and one tRNA gene) divided into three classes are shown. The y axes show normalized gene expression levels.

