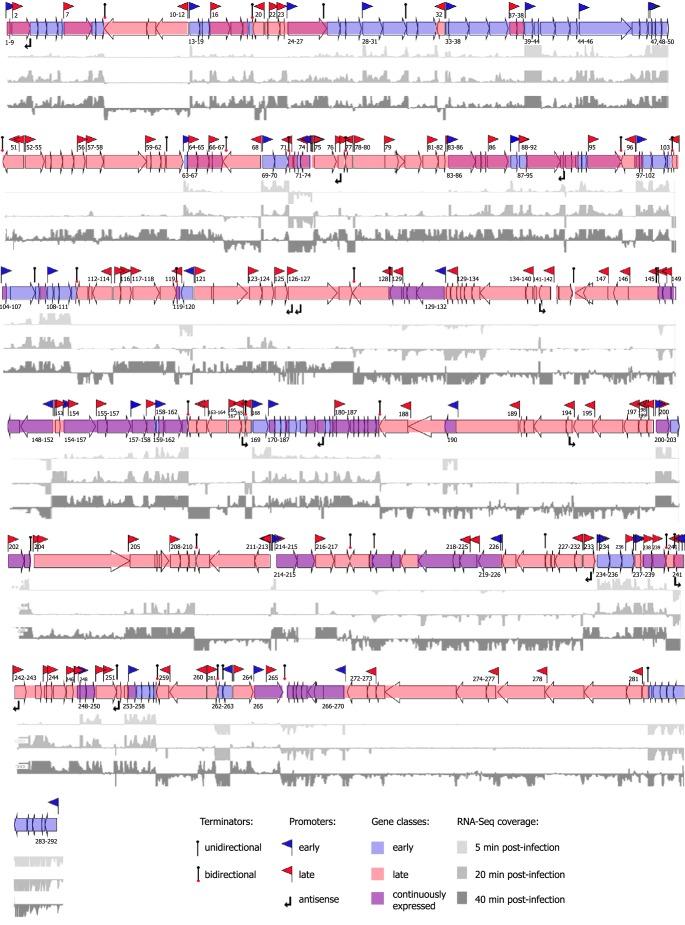
FIG 6 .
Operon organization of bacteriophage AR9 genes. Shown is a schematic representation of the AR9 genome combined with cDNAs of 5 (light gray)-, 20 (darker gray)-, and 40 (dark gray)-min cDNA libraries mapped on both strands of phage DNA. Coverage for the 5-min time point is shown within a −100-to-100 window size, and that for the 20- and 40-min time points is shown within a −200-to-200 window size. Promoters and terminators are indicated. Early operons are labeled (with numbers marking corresponding genes) below the arrows representing the genes, and late operons are labeled above the arrows representing the genes. The data used to construct this map are available in Tables S2 to S4.

