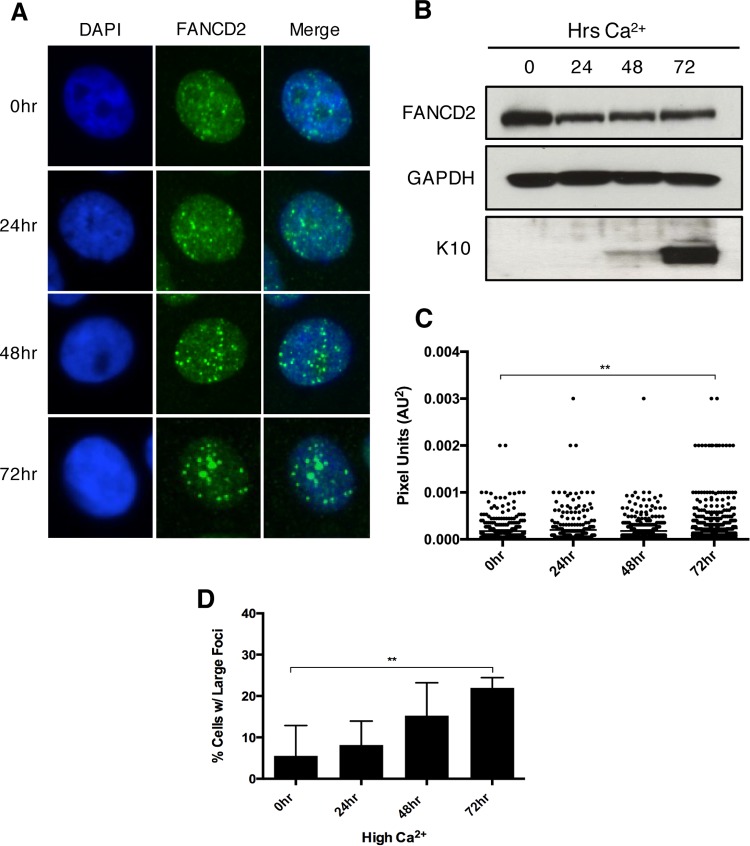
FIG 3 .
FA pathway activation further increases as differentiation progresses in HPV-positive cells. (A) Immunofluorescence analysis of FANCD2 localization in CIN612 cells that were differentiated in 1.5 mM calcium for 24, 48, or 72 h. Cells were stained with anti-FANCD2 (green) and counterstained with DAPI (blue). (B) Western blot analysis of FANCD2 levels in CIN612 cells that were differentiated in high-calcium medium for 24, 48, or 72 h. GAPDH was used as a loading control. Epithelial differentiation was confirmed by levels of cytokeratin 10. (C) ImageJ software was used to quantitate focus size by an automated particle analysis program. The graph represents individual focus size represented in pixel units (AU2). Error bars represent the standard error mean within the sample. A standard Student’s t test was used to determine statistical significance. **, P ≤ 0.005. (D) The graph demonstrates the percentage of cells with large nuclear FANCD2 foci. Error bars represent the standard deviations between experiments. A standard Student’s t test was used to determine statistical significance. **, P ≤ 0.005.

