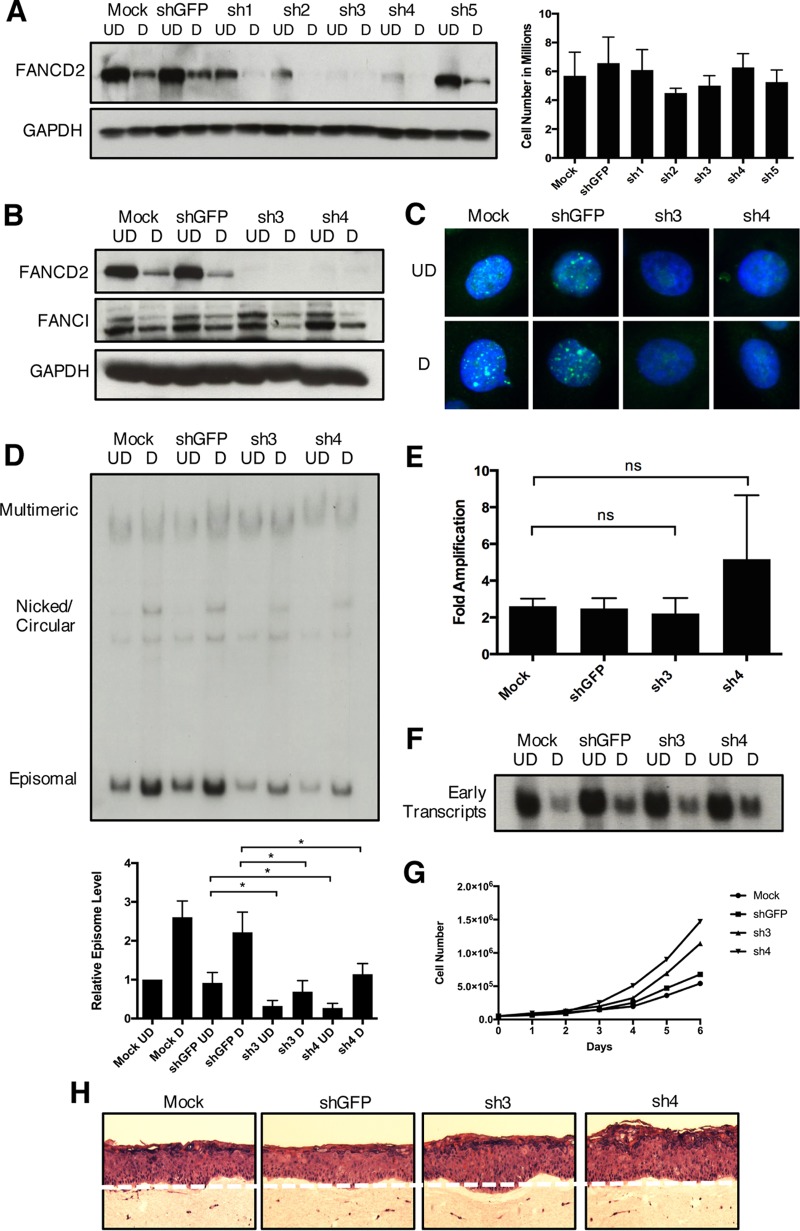
FIG 8 .
Knockdown of FANCD2 limits HPV31 replication. (A) CIN612 cells were transiently transduced with lentiviral vectors encoding five individual shRNAs against FANCD2 or GFP as a control. After 48 h, cells were differentiated in 1.5% methylcellulose for an additional 48 h. FANCD2 knockdown was assessed by Western blot analysis using GAPDH as a loading control. At 96 h posttransduction, cells were harvested and stained with trypan blue (Bio-Rad) to assess cell viability. The graph shows the total number of live cells in monolayer culture at the time of collection. Error bars represent the standard deviations between measurements. UD, undifferentiated; D, differentiated. (B) CIN612 cells transduced with shGFP or shFANCD2 were differentiated for 48 h in 1.5% methylcellulose, and Western blot analysis was used to assess FANCD2 and FANCI protein levels. GAPDH was used as a loading control. (C) Immunofluorescence analysis of control and FANCD2 knockdown cells that were differentiated for 72 h in 1.5 mM calcium medium. Cells were stained with anti-FANCD2 (green) and counterstained with DAPI (blue). (D) CIN612 cells were differentiated for 48 h in 1.5% methylcellulose, and total DNA was isolated from control and shFANCD2 cells. Viral replication was assessed by Southern blot analysis. Similar results were seen using high calcium concentrations to induce differentiation (Fig. S2). Quantification of episomal band intensity was determined by densitometry using Image Lab software and normalized to the undifferentiated shGFP-infected sample across three independent experiments. Differences in episomal levels between mock- and shGFP-infected cells were not statistically significant. Error bars represent the standard deviations between experiments. A standard Student’s t test was used to determine statistical significance. *, P ≤ 0.05. (E) The ratio of episomal DNA in undifferentiated and differentiated samples was calculated to determine fold amplification in knockdown and control cells. Error bars represent the standard deviations between experiments. ns, not significant. (F) Control and shFANCD2 cells were differentiated for 48 h in 1.5% methylcellulose. Total RNA was isolated, and early transcript expression was determined by Northern blot analysis. The Northern blot shows expression of the primary early transcript E6*E7 E1^E4 E5. (G) CIN612 cells that stably express either control or shFANCD2 were seeded at 5 × 10⁴ into each well of a 6-well cell culture dish. Cells were harvested and counted each day for 6 days or until reaching confluence. (H) H&E stain of control of shFANCD2-expressing HFK31 cells that were differentiated for 14 days in organotypic raft culture. Similar results were seen in CIN612 cells grown in raft culture.

