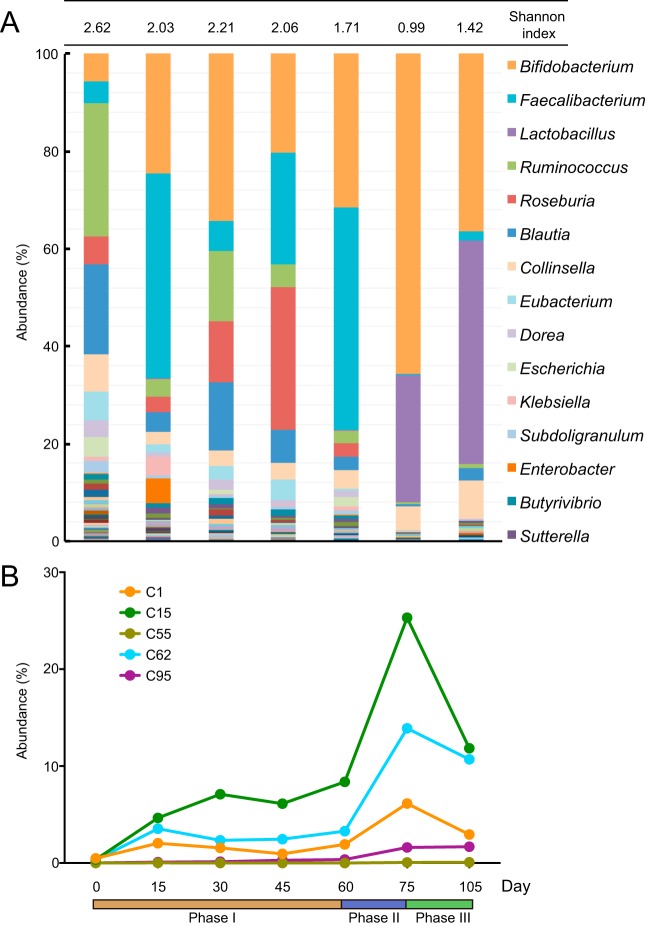
FIG 2 .
Shifts of the gut microbiota during the dietary intervention. (A) Genus-level gut microbiota compositions at the seven time points. The Shannon index values are shown in panel A. According to the average abundance, the top 15 genera are labeled with their taxonomic names. (B) The differential abundances of the 5 B. pseudocatenulatum strains. Phase I, day 0 to day 60, basic dietary intervention; phase II, day 60 to day 75, basic intervention plus 100 g more Formula No. 3; phase III, less Formula No. 1 plus 100 g more Formula No. 3.

