Fig. 2.
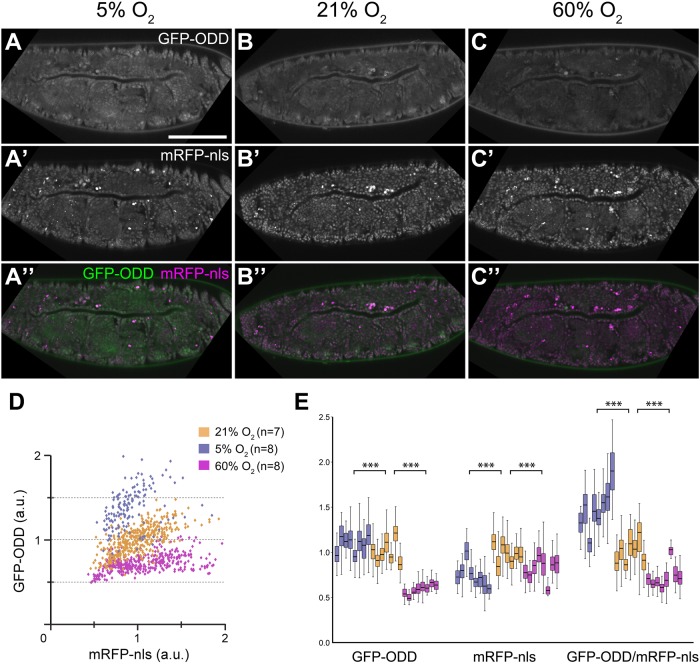
GFP-ODD responds to changes in ambient O2 concentrations. Embryos incubated at three different O2 concentrations show decreasing levels of GFP-ODD fluorescence with the highest levels under hypoxia (5% O2; A), lower levels under normoxia (21% O2; B) and further reduced levels under hyperoxia (60% O2; C). (A′,B′,C′) Conversely, fluorescence intensity of mRFP-nls shows comparatively little changes in the three O2 conditions. (A″,B″,C″) The merge of the two channels, indicating the GFP-ODD (green)/mRFP-nls (magenta) ratio, as basis for the ratiometric analysis. (D) Analysis of the hypoxic state of individual cells. GFP-ODD and mRFP-nls intensities were analysed in nuclei of embryonic tracheal cells. The scatter plot shows normalised intensities (a.u., arbitrary units) of each channel, representing changes in fluorescence signals. Each point corresponds to a single nucleus. The number of embryos (n) analysed for each condition is indicated. (E) Changes in individual fluorescence channels and GFP-ODD/mRFP-nls ratios for each O2 condition. Each box plot represents data from a single embryo in which fluorescence was measured in at least 35 cells. Scale bar: 100 µm. ***P≤0.001; Mann-Whitney U-test.

