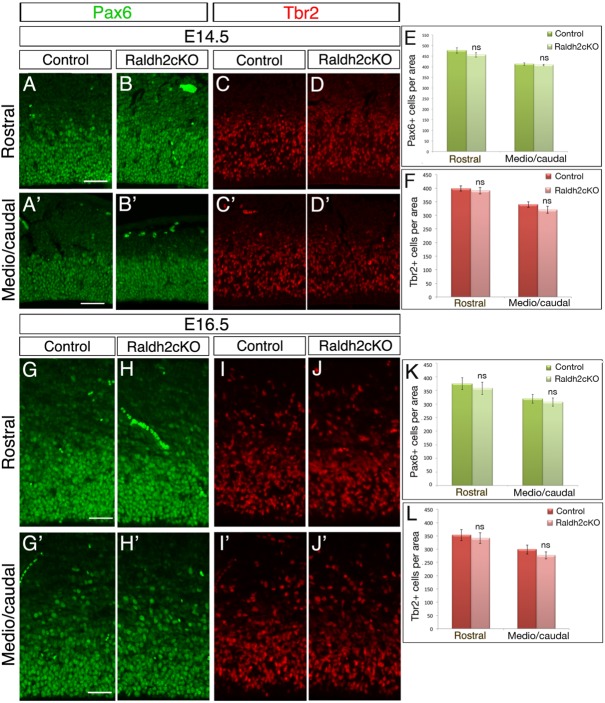
Fig. 5.
Raldh2cKO does not affect cortical NPCs. (A-D′) Immunolabellings on brain sections from E14.5 control and Raldh2cKO animals for Pax6 (A-B′) or Tbr2 (C-D′) at rostral (A-D) and more caudal levels (A′-D′) used for quantification. (G-J′) Immunolabellings on brain sections from E16.5 control and Raldh2cKO animals for Pax6 (G-H′) or Tbr2 (I-J′) at rostral (G-J) and medial levels (G′-J′) used for quantification. (E) Quantification of Pax6-positive cells at E14.5; rostrally: 477.13±13.10 for control and 456±10.48 for Raldh2cKO; caudally: 412.73±6.14 for control and 408.2±3.49 for Raldh2cKO. (F) Quantification of Tbr2-positive cells at E14.5; rostrally: 398.66±9.23 for control and 390.47±11.37 for Raldh2cKO; caudally: 339.47±9.89 for control and 320.13±12.49 for Raldh2cKO. (K) Quantification of Pax6-positive cells at E16.5; rostrally: 374.06±21.71 for control and 357.26±22.71 for Raldh2cKO; caudally: 319±16.42 for control and 306.99±15.28 for Raldh2cKO. (L) Quantification of Tbr2-positive cells at E16.5; rostrally: 353.2±20.93 for control and 341.2±20.23 for Raldh2cKO; caudally: 298.46±16.96 for control and 276.66±13.27 for Raldh2cKO. Data presented as mean±s.e.m.; n=5 brains; ns, not significant by two-tailed Student's t-test. Scale bars: 50 μm.

