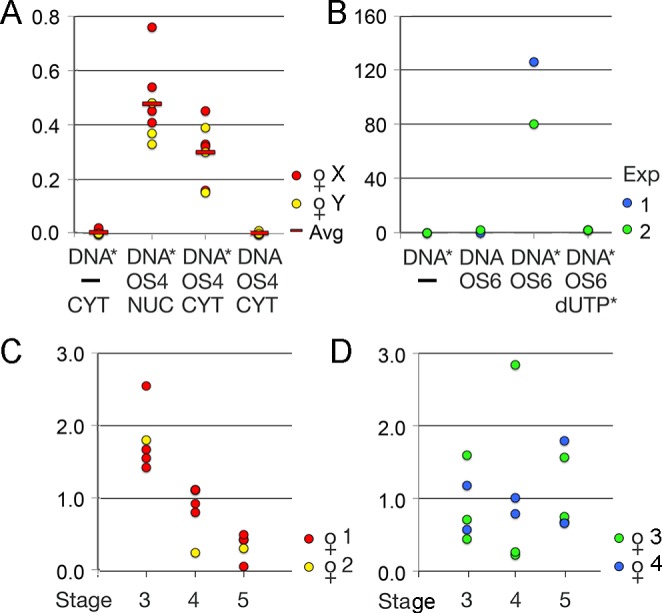
Fig. 3.

Transport of biotinylated DNA. (A) Transport from cytoplasm to nucleus in oocytes collected from two females (X,Y). Linearized Reco-σ, biotinylated (DNA*) or untreated (DNA), was injected without (–) or with OS4 shuttle protein into the cytoplasm (CYT) or nucleus (NUC). The numbers of TetR colonies obtained with DNA recovered from these oocytes were normalized (ratio) to the number of colonies obtained in the same series by direct nuclear injection of linearized Reco-σ. Red bars (Avg) depict mean values in each experimental point. (B) Transport from blood to oocyte nucleus in situ. Two independent competition experiments in which biotinylated Reco-σ alone (DNA*), non-biotinylated Reco-σ (DNA), or biotinylated Reco-σ mixed with OS6 protein, or a mixture of OS6 protein pre-incubated with excess 14biotindUTP was injected, each mix into two females. Values indicated are TetR colonies per plate. (C,D) Biotinylated Reco-σ (DNA*) linked to OS6 protein was injected into four females. After two days, DNA was extracted from batches of stage 3, 4 or 5 oocytes and used to transform bacteria that were first grown on ampicillin and then replica-plated on tetracycline plates. The uptake of donor DNA was highest in stage 3 oocytes of females 1 and 2 (C), whereas in females 3 and 4 (D), the oocytes of all stages took up variable amounts of DNA with no clear preference for a given stage. The values are given as the ratio of TetR colonies per batch over the average number of TetR colonies in all batches of the same female.
