Fig. 1.

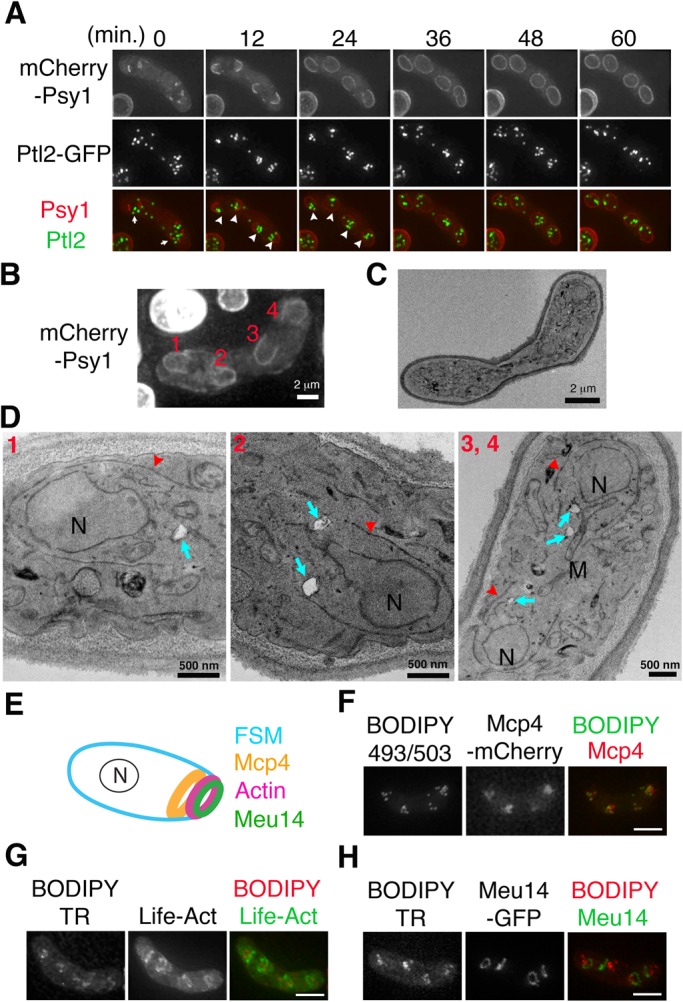
Dynamics of LDs during spore formation. (A) Representative time-lapse images of the FSMs engulfing the LDs observed in living S. pombe cells expressing the FSM marker mCherry-Psy1 and the LD marker Ptl2-GFP (11 cells observed). FSM and LDs are shown in red and green, respectively. LDs appeared as distinct focal structures. FSM initiation (detected as aggregation of the mCherry-Psy1 fluorescence signals in the cytoplasm) was designated as 0 min. The arrows at 0 min indicate clustering of LDs near the FSM initiation site. The arrowheads at 12 min indicate four LD clusters near the FSM leading edges. The arrowheads at 24 min indicate inclusion of the LDs by FSM extension. Scale bar: 5 µm. (B) Fluorescence images of FSM extension. Cells expressing mCherry-Psy1 were fixed for EM imaging (see Materials and Methods). The numbers 1–4 represent the four FSMs. Scale bar: 2 µm. (C) TEM image of the same cell shown in (B). Scale bar: 2 µm. (D) Magnified TEM images of the cell depicted in (C). Each of the numbered images corresponds to the numbered FSMs in (B). The red arrowheads indicate the FSM. The cyan arrows indicate LDs, which appear as white matter when visualized by TEM. N, nucleus; M, mitochondria. Scale bar: 500 nm. (E) Localization of the LEP rings at the FSM leading edge. N, nucleus. (F-H) Co-localization of LDs and LEPs. Immediately before imaging, the fluorescent dye BODIPY493/503 or BODIPY TR was added to the sporulation medium containing cells expressing Mcp4-mCherry, Meu14-GFP, or LifeAct-GFP. The BODIPY dyes stain LDs. LifeAct-GFP binds to actin filaments to allow visualization of the meiotic actin ring (Yan and Balasubramanian, 2012). Scale bar: 5 µm.
