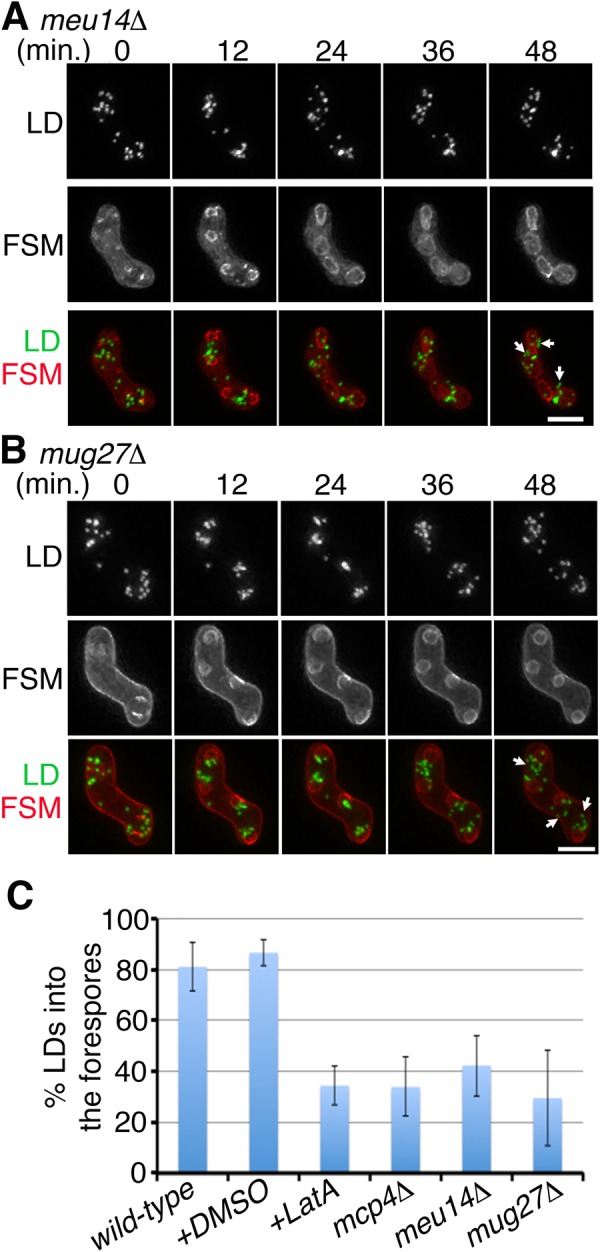
Fig. 3.

LEPs are important for efficient inclusion of LDs. (A,B) Representative time-lapse images of LD movements during FSM assembly in the meu14Δ mutant (A) (12 cells observed) and the mug27Δ mutant (B) (14 cells observed); Ptl2-GFP (LDs) and mCherry-Psy1 (FSMs) are shown in green and red, respectively. The arrowheads at 12 min indicate the FSM leading edges, without association of the LDs in the meu14Δ mutant. The arrows at 48 min indicate the LDs remaining in the ascus cytoplasm. Scale bar: 5 µm. (C) Quantification of LDs enclosed by FSMs in the various strains. Time-lapse images of 10 samples for each strain were counted. The number of LDs in a sporulating cell was quantified at 48 min or after. Percentage of LDs transported into the forespore=(number of LDs enclosed by the FSM/total number of LDs)×100%. The graph and the error bar represent mean and standard deviation, respectively.
