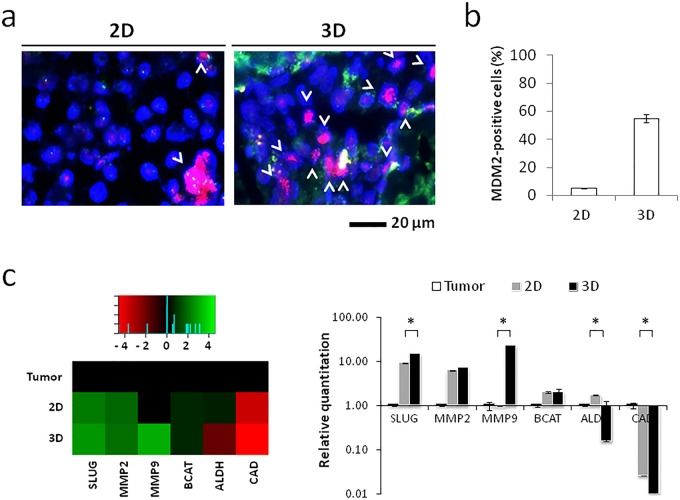
Fig. 2.
Liposarcoma cells enrich in the 3D tumor model. (A) Fluorescence in situ hybridization for MDM2 amplification in 2D and 3D cultured liposarcoma cells. Arrowheads represent the cells with MDM2 amplification. (B) Percentages of cells positive for MDM2 amplification in 2D and 3D cultures. Data are mean±s.d. (n=3). (C) Heatmap representation and relative quantitation values of Slug (SLUG), beta-catenin (BCAT), matrix metalloproteinase 2 (MMP2), matrix metalloproteinase 9 (MMP9) and aldehyde dehydrogenase 1 (ALDH) in 2D and 3D cultured primary liposarcoma cells and in the patient's original tumor specimen. Data are mean±s.d. (n=3). Unpaired t-test between 2D and 3D relative quantitation values, *P=0.0063 for SLUG, *P=0.092 for CAD, *P=0.0114 for MMP9, *P=0.0026 for ALDH.

