Fig. 1.
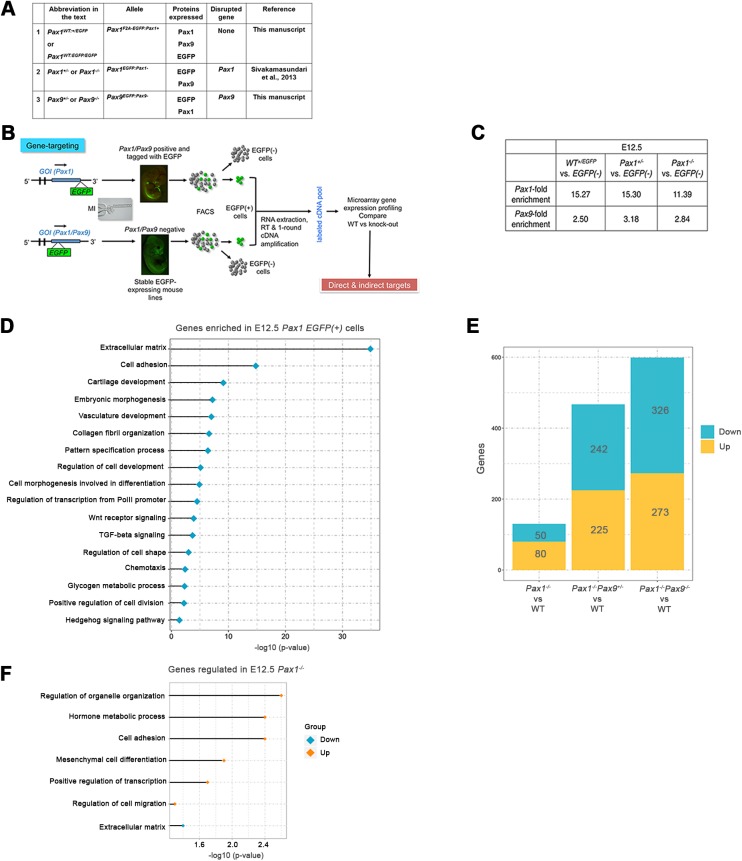
Experimental workflow and differentially expressed genes in Pax1/Pax9 mutants. (A) Abbreviations of Pax1 and Pax9 EGFP-expressing mouse lines. (B) Diagrammatic representation of experimental workflow. (C) Pax1 and Pax9 fold enrichment in EGFP(+) cells compared to EGFP(−) cells from E12.5 embryos. (D) Bar chart of enriched GO terms in E12.5 Pax1 EGFP(+) cells. (E) Number of differentially expressed genes for the various genotype comparisons. (F) Bar chart of enriched GO terms for down-regulated and up-regulated genes in E12.5 Pax1−/− embryos. GOI, gene of interest; EGFP, enhanced green fluorescent protein; FACS, fluorescence activated cell sorting; GO, gene ontology; WT, wild type.

