
Figure 5.
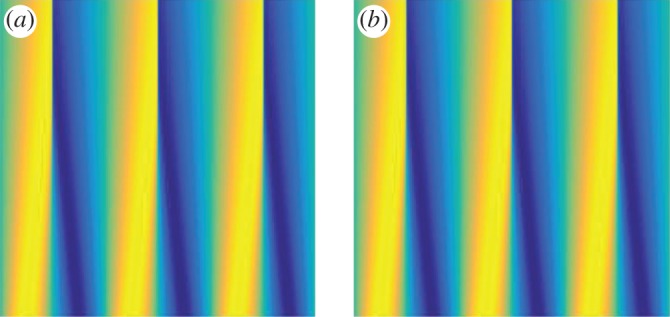
Example 3.2: inviscid Burgers' equation with noise =73.7%. The space–time dynamics are plotted to provide a qualitative comparison between the original simulation (a) and the learned dynamics (b) over time. The error between the original simulation and the learned solution is small in norm: the L1 error is 0.0163, the L2 error is 0.0193 and the error is 0.2705, which also includes the projection errors (difference in grid sizes). The horizontal axis is space and the vertical axis is time. (Online version in colour.)