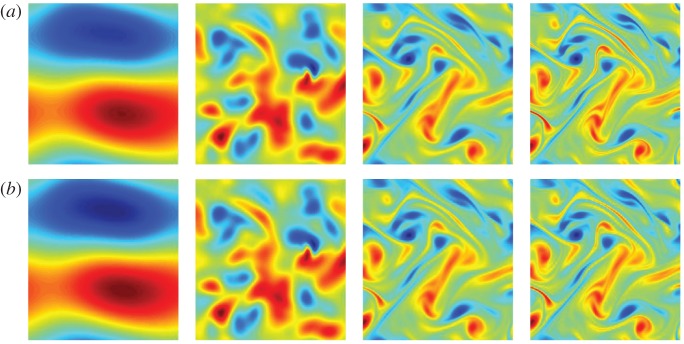
Figure 8.
Example 3.6 Navier–Stokes, high Reynolds number. (a) shows the original simulation using 1 048 576 grid points and (b) uses the coefficients from tables 5 and 6 to compute the solution with 65 536 grid points. From left to right the columns use: , Re=4, Re=100 and Re=1024. (Online version in colour.)

