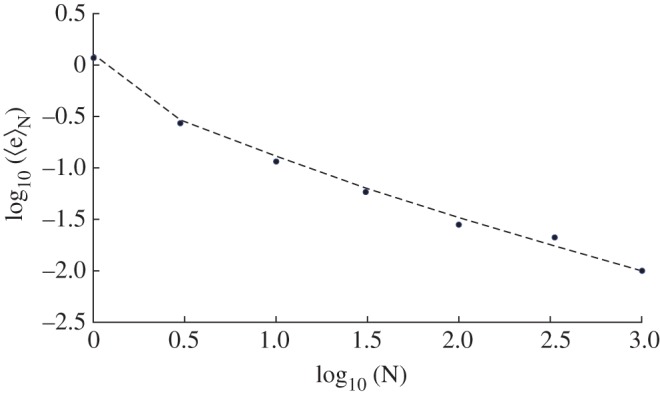
Figure 4.

Error (4.14) to prediction (3.23) for the elastic relaxation versus the number of observations. The dotted line represents the prediction given by the theoretical estimate (3.26), whereas black bullets are the results obtained with numerical stochastic average in the presence of noise amplitude . (Online version in colour.)
