
Fig. 8.
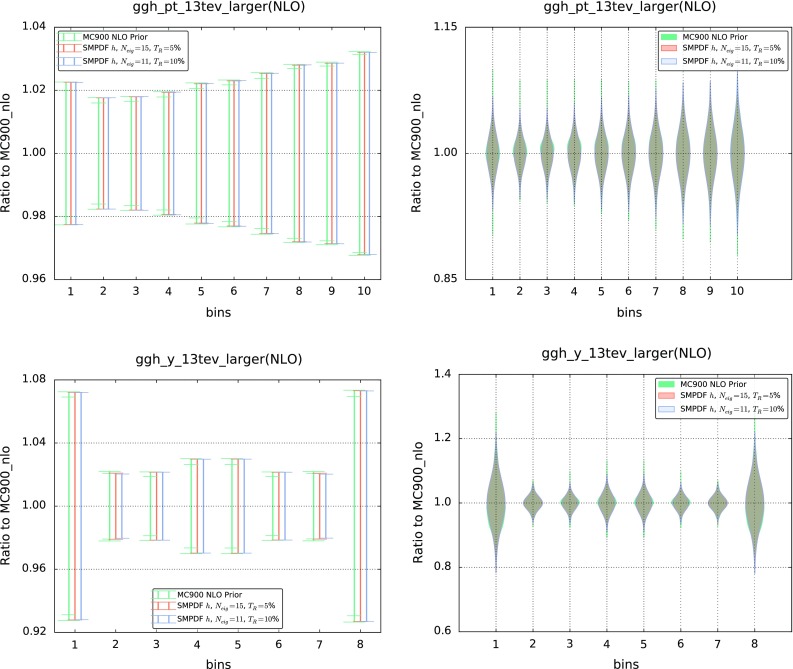
The and rapidity distributions for Higgs production in gluon fusion, computed with the MC900 prior and with the Higgs SM-PDFs, for two values of the tolerance , this time in a kinematic range that doubles that of the input processes in Table 1 (see text). In the left plot we show the standard deviation in each bin, while in the right plot we show the full probability distributions per bin, reconstructed using the Kernel Density Estimate (KDE) method