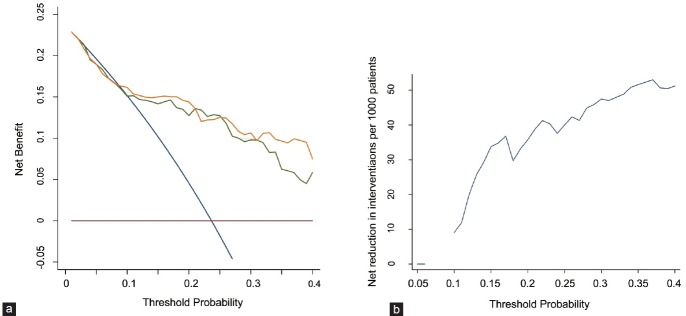
Figure 4.
Decision curve analysis of the base model and the PCA3-based model in patients with a PSA of 4.0–10.0 ng ml−1. (a) The green line indicates the base model; the orange line indicates the prediction model that includes only age, PSA, %fPSA, prostate volume and PCA3 score. The horizontal line along the x-axis assumes that no patient will have PCa (no patient should undergo a prostate biopsy), whereas the solid gray line assumes that all patients will have PCa (all patients will need to undergo a prostate biopsy). (b) Net reduction in biopsies per 100 patients by threshold probability.

