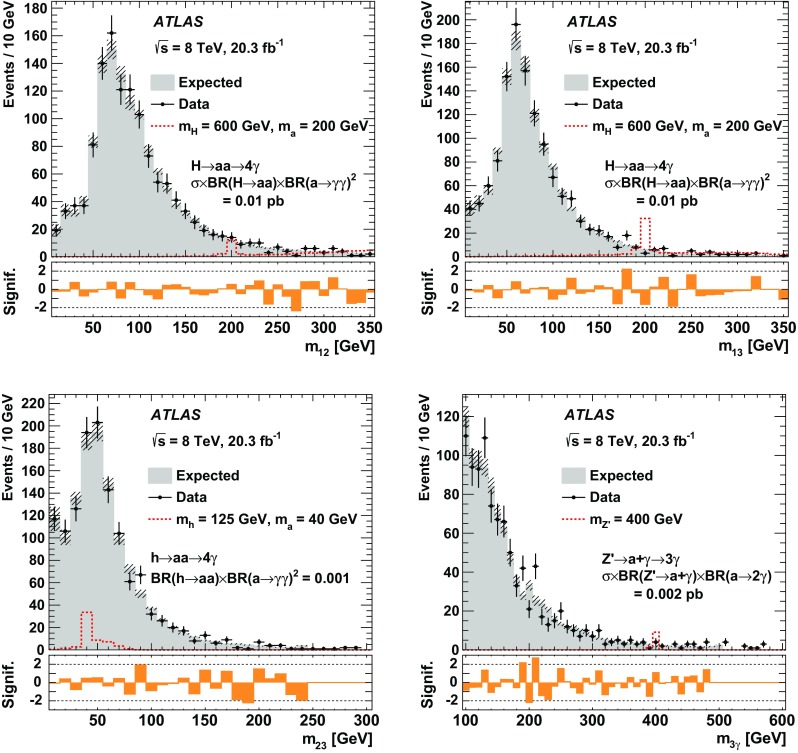
Fig. 3.

Observed spectra of , , and , where the 1, 2, and 3 refer to three -ordered photons, as well as . For illustration purposes only, also shown is the expected background per bin, determined via unbinned sideband fits to the data as a part of the resonance search, for a hypothesised resonance mass defined by the centre of the bin, as well as the signal expectation for a few mass points for the BSM scenarios considered here. The lower panels show the significance, in units of standard deviations of a Gaussian function, of the observation in each bin, taking into account the fractional uncertainty on the background as a result of the sideband fit. This significance is derived from the p value for the background-only hypothesis for each bin, calculated using a frequentist binomial parameter test [43–45]. The signal distributions used for the resonance searches have two components, a narrow Gaussian core for correctly paired two-photon combinations and a wide distribution for incorrectly paired combinations that is well described by the polynomial used to simultaneously model the background shape for the resonance search described in Sect. 7.2
