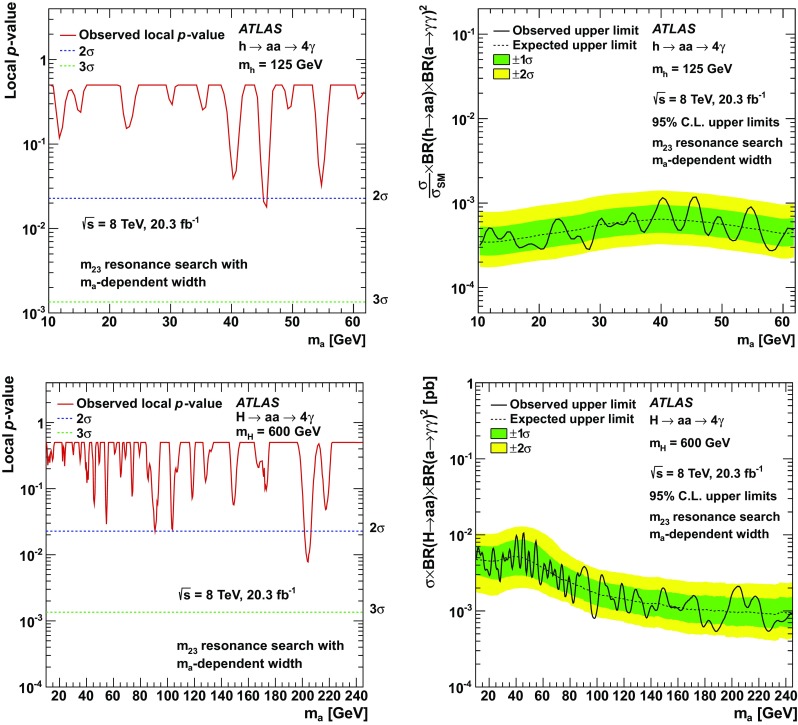
Fig. 4.

Left local p values for the background-only hypothesis as a result of a resonance search with respect to the BSM process , for = 125 GeV (top row) and = 600 GeV (bottom row), as a function of , determined via a search for local excesses in the spectrum. Right upper limits, at the 95 % CL, on (top row) and (bottom row). Also shown are the and uncertainty bands resulting from the resonance search hypothesis tests, taking into account the statistical and systematic uncertainties from simulated signal samples which are used to determine signal efficiency and Gaussian resonance width due to detector resolution for each mass hypothesis
