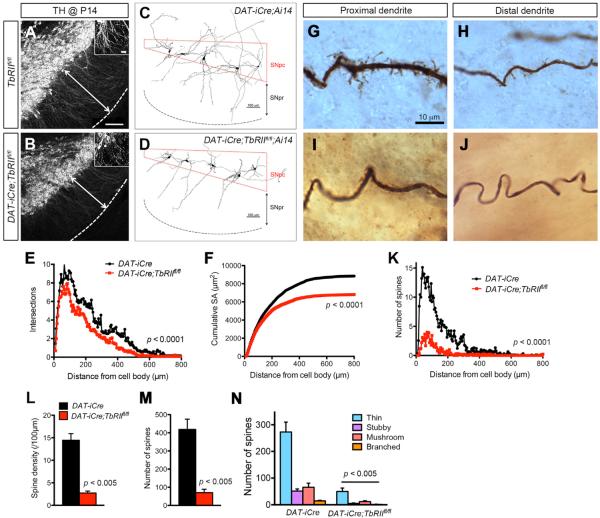
Figure 2. Loss of TβRII in DA Neurons Reduces Dendritic Length and Complexity.
(A and B) TH immunofluorescent stain highlights DA neuron dendrites extending into SNpr in P14 TbRIIfl/fl and DAT-iCre;TbRIIfl/fl mice. Scale bars, 200 μm in (A) and 20 μm in insets.
(C and D) Neurolucida 3D reconstructions of biocytin-labeled individual DA neuron in P14 DAT-iCre and DAT-iCre;TbRIIfl/fl brains.
(E and F) Quantification of dendritic complexity by Sholl analysis (genotype: F1,2554 = 86.97, p < 0.0001, two-way ANOVA) and cumulative surface area (genotype: F1,2554 = 161.90, p < 0.0001, two-way ANOVA) of biocytin-labeled neurons (n = 9 from three DAT-iCre;Ai14 and n = 11 for four DAT-iCre;TbRIIfl/fl;Ai14 mice).
(G–J) Spine density and morphology in proximal and distal dendrites of biocytin-labeled DA neurons in P14 DAT-iCre and DAT-iCre;TbRIIfl/fl brains.
(K–M) Number of spines plotted against distance from the cell body (n = 9 neurons per group, genotype: F1,2496 = 773.54, p < 0.0001, two-way ANOVA) (K), spine density (p < 0.005, Student's t test) (M) and total number of spines (p < 0.005, Student's t test) (N). Data are presented as mean ± SEM.
(N) Quantification of thin, stubby, mushroom and branched spines in biocytin-labeled DA neurons in P14 TbRIIfl/fl and DAT-iCre;TbRIIfl/fl mice (n = 9 neurons per group). Data are presented as mean ± SEM, Student's t test. p < 0.005.

