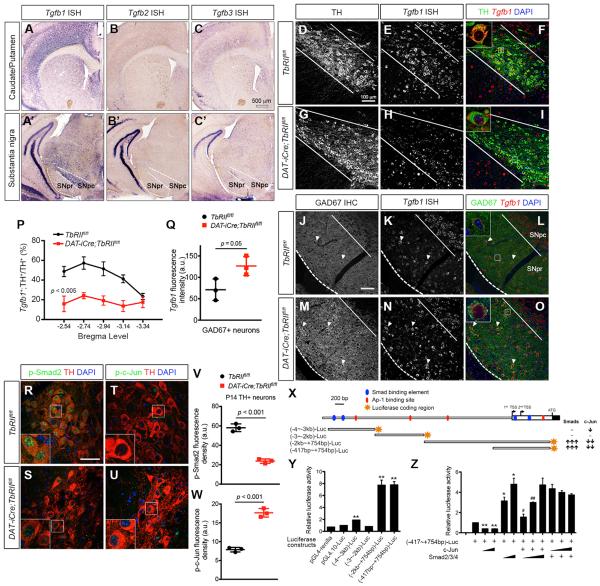
Figure 4. Autoregulation of Tgfb1 Expression in DA Neurons by Smad2 and c-Jun.
(A–C and A′–C′) In situ hybridization for Tgfb1, Tgfb2, and Tgfb3 mRNA using isoform-specific antisense RNA probes showed high abundance of Tgfb1 mRNA in SNpc, but no detectable Tgfb2 and Tgfb3 mRNA. A very low level of Tgfb1 mRNA can also be detected in the caudate/putamen. Scale bar, 500 μm.
(D–O) Tgfb1 mRNA expression in P28 control and DAT-iCre;TbRIIfl/fl mutant DA and GABAergic neurons. Confocal images of TH and GAD67 immunostaining (green) combined with fluorescent in situ hybridization for Tgfb1 mRNA expression (red) in TbRIIfl/fl and DAT-iCre;TbRIIfl/fl DA neurons. Scale bars, 100 μm. Higher magnification of single cells shown as insets in (F), (I), (L), and (O).
(P) Percentage of Tgfb1+;TH+ neurons across five bregma levels (n = 4 for TbRIIfl/fl and DAT-iCre-TbRIIfl/fl mice, genotype: F1,28 = 54.45, p < 0.005, two-way ANOVA).
(Q) Tgfb1 mRNA fluorescence intensity in individual GAD67+ neurons (n = 3 for TbRIIfl/fl and n = 4 for DAT-iCre-TbRIIfl/fl mice), p = 0.05, Student's t test). Data are presented as mean ± SD.
(R–U) Confocal images show reduced p-Smad2 and increased p-c-jun in TH+ DA neurons (red) in P14 DAT-iCre;TbRIIfl/fl mice. Insets show higher-magnification images. Scale bar, 60 μm.
(V and W) Fluorescent intensity of p-Smad2 and p-c-Jun in DA neurons in TbRIIfl/fl and DAT-iCre;TbRIIfl/fl at P14 (n = 3 per genotype). Data are presented as mean ± SD p < 0.001, Student's t test.
(X) Schematic diagram of the mouse Tgfb1 promoter region and summary of luciferase assays using reporter constructs generated from 5 kb upstream of the transcriptional start site in mouse Tgfb1 locus reveal positive and negative regulations of Tgfb1 transcription by Smad and c-Jun, respectively.
(Y) Relative luciferase activity of reporter constructs, (−4 kb~−3 kb)-Luc, (−3 kb~−2 kb)-Luc, (−2 kb~+754 bp)-Luc and (−417 bp~+754 bp)-Luc (normalized to pGL4.10-Luc activity).
(Z) Neuro-2A cells were co-transfected with (−417 bp~+754 bp)-Luc and plasmids encoding Smad2/3/4 or c-Jun. *p < 0.05 and **p < 0.01, when compared to (−417 bp~+745 bp)-Luc, and #p < 0.05 and ##p < 0.01, when compared to (−417 bp~+745 bp)-Luc. n = 3 for each reaction, Student's t test.

