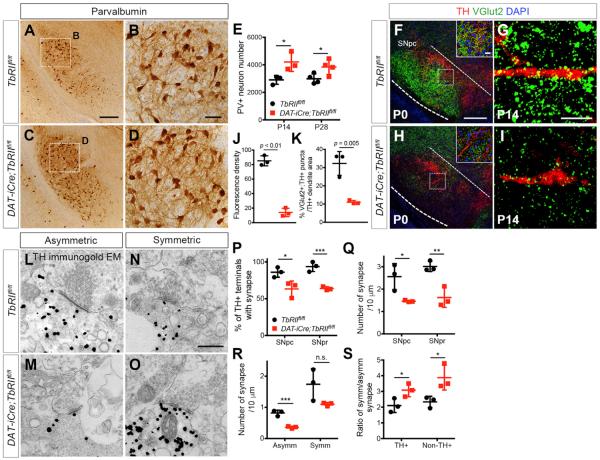
Figure 5. Loss of TGF-β Signaling in DA Neurons Reduces Excitatory Synaptic Inputs but Increases Inhibitory Synaptic Inputs.
(A–D) Immunohistochemistry of PV+ neurons in SNpr of P14TbRIIfl/fl and DAT-iCre;TbRIIfl/fl mice. Scale bars, 200 μm (A) and 50 μm (B).
(E) Stereological quantification of PV+ neuron number at P14 (n = 3) and P28 (n = 4) *p < 0.05, Student's t test.
(F–I) Confocal images of DA neurons immunostained for VGlut2 (green) and TH (red) in TbRIIfl/fl and DAT-iCre;TbRIIfl/fl mice at P0 and P14. Scale bars, 100 μm and 20 μm (inset).
(J) Density of VGlut2+ synapses at P0 (n = 3, 9 fields per genotype, ***p < 0.01, Student's t test).
(K) Percentage of VGlut2+;TH+ puncta per unit TH+ dendrite area at P14 (n = 3 for TbRIIfl/fl and DAT-iCre;TbRIIfl/fl mice, 35–38 fields analyzed per mouse, p = 0.005, Student's t test).
(L–O) Immunogold electron micrographs of TH-labeled synapses in P14 TbRIIfl/fl and DAT-iCre;TbRIIfl/fl. Examples of asymmetric (L and M) and symmetric (N and O) synapses onto TH+ dendrites. Scale bar, 500 nm.
(P–S) Number of TH+ terminals with synapses in SNpc and SNpr (P), synapse number normalized to TH+ terminal circumference in SNpc and SNpr (Q), asymmetric and symmetric synapse density in SNpc (R), and the ratio of symmetric versus asymmetric synapses in TH+ and non-TH+ terminals (S) (n = 3 per genotype). *p < 0.05, **p < 0.01, ***p < 0.005, n.s., not significant. Data are presented as mean ± SD, Student's t test.

