
Fig. 3.
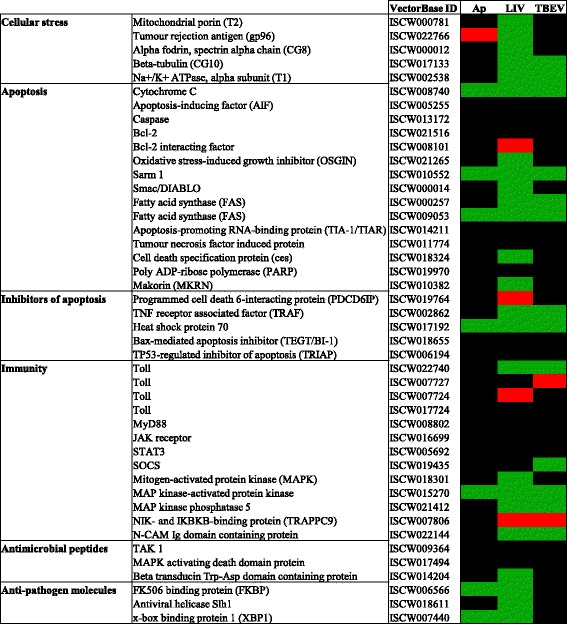
Summary of differential gene expression for selected genes, highlighted green (upregulated), red (downregulated) or black (no significant change), following infection of IRE/CTVM20 cells with A. phagocytophilum (Ap), LIV or TBEV
Official websites use .gov
A
.gov website belongs to an official
government organization in the United States.
Secure .gov websites use HTTPS
A lock (
) or https:// means you've safely
connected to the .gov website. Share sensitive
information only on official, secure websites.
Summary of differential gene expression for selected genes, highlighted green (upregulated), red (downregulated) or black (no significant change), following infection of IRE/CTVM20 cells with A. phagocytophilum (Ap), LIV or TBEV