
Figure 3. lncRNA-CLMAT3 controlled cell cycle progression and apoptosis in LOVO cells.
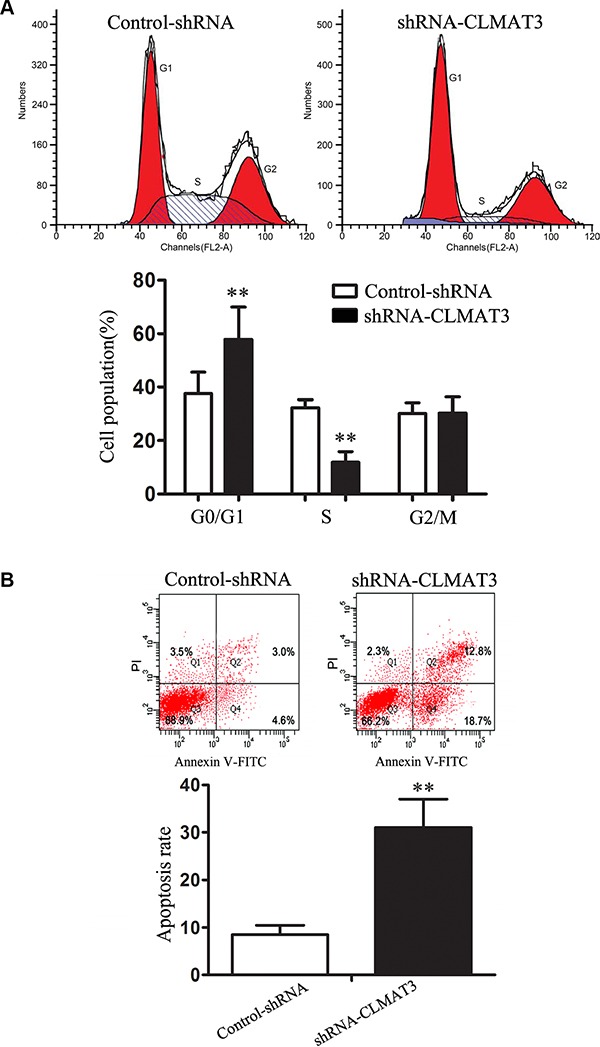
(A) Cell cycle analysis was performed using flow cytometry (above panel). Representative histograms are shown (below panel). **P < 0.01 compared with control shRNA. (B) Apoptosis was assayed by flow cytometry (above panel). The bar chart represents the sum percentage of early and late apoptotic cells (below panel). **P < 0.01 compared with control shRNA.