
Figure 1. Manhattan plot of discovery panel.
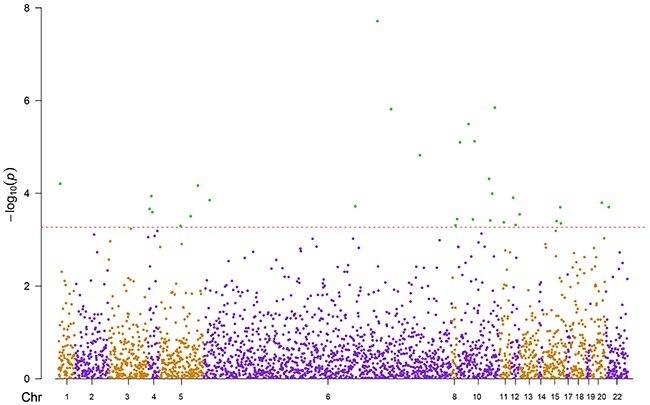
Red line: raw p-value of FDR = 0.05; Green dots: 31 significant sites; Chr: chromosome position
Official websites use .gov
A
.gov website belongs to an official
government organization in the United States.
Secure .gov websites use HTTPS
A lock (
) or https:// means you've safely
connected to the .gov website. Share sensitive
information only on official, secure websites.
Red line: raw p-value of FDR = 0.05; Green dots: 31 significant sites; Chr: chromosome position