
Figure 1. Analysis of ZFP36 expression in CRC-related samples.
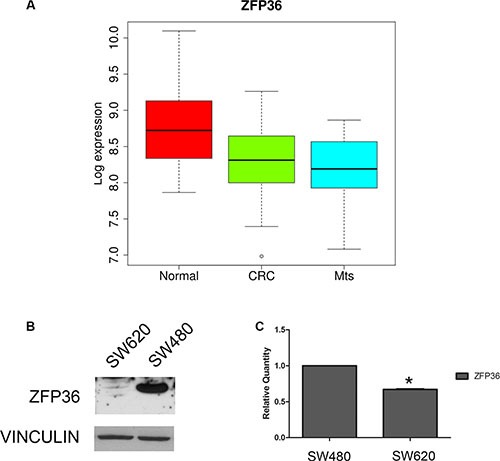
(Panel A) Boxplot of ZFP36 mRNA Log2 expression levels evaluated in a GEO database of gene expression profiles derived from 23 normal colon mucosa (Normal), 30 primary colon carcinoma (CRC) and 27 liver metastases (Mts) samples. The thick line indicates the median value, the coloured box indicates the interquartile range and the whiskers the minimum and maximum values excluded outliers. Open circles represent data points outside the whiskers. (Panel B) ZFP36 protein expression in CRC cell lines derived from primary tumour (SW480) and matched metastatic lesion (SW620). Vinculin was used as loading control. (Panel C) ZFP36 mRNA levels detected in SW480 and SW620 cell lines through qRT-PCR. Results are represented as means of two experiments (+/− SEM) and GAPDH was used as endogenous control. *p < 0.05.