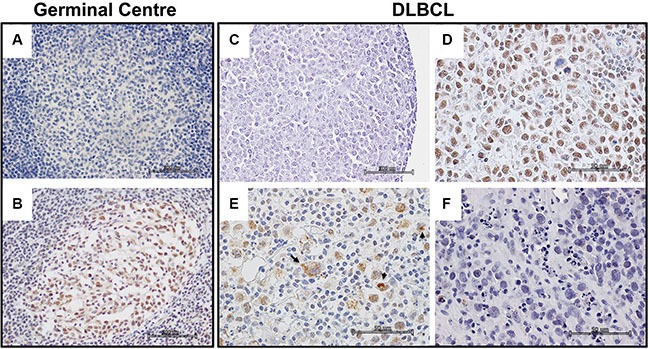
Figure 1. PATZ1 immunohistochemical expression in human Germinal Centre and DLBCLs.

(A–B) Representative images of a germinal centre in a tonsil follicular hyperplasia control: (A) No antibody negative control; (B) PATZ1 staining. (C–F) Representative images of different PATZ1 expression and sub-cellular localization in DLBCLs: (C) No antibody negative control; (D) PATZ1 nuclear expression; (E) PATZ1 nuclear/cytoplasmic expression, arrows indicate cells with cytoplasmic staining; (F) PATZ1 negative expression. Scale bars: 100 μm in A, B and C; 50 μm in D, E and F.
