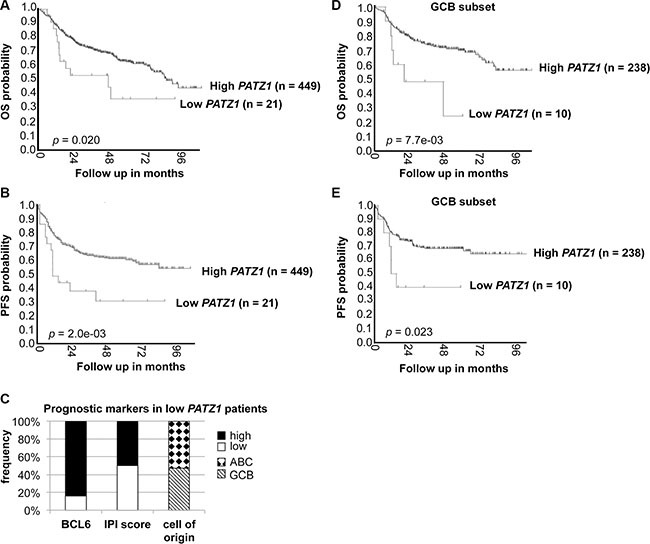
Figure 7. PATZ1 gene expression correlates with survival in DLBCL patients treated with R-CHOP.

(A) Overall (OS) and (B) Progression-Free (PFS) Kaplan–Meier survival curves of DLBCL patients treated with R-CHOP, adapted from the genomic Analysis and Visualization platform (http://r2.amc.nl). Note that patients with lower PATZ1 expression have a worse OS and PFS survival rate than patients with higher PATZ1 expression as assessed by LogRank test (p < 0.05 and 0.01, respectively). (C) BCL6 protein expression, IPI score and cell of origin in patients with low PATZ1 expression in the PFS survival curve. Cutoff score of 33% was used for BCL6, as previously reported (25). (D) OS and (E) PFS Kaplan-Meier survival curves of the GCB subset of DLBCL patients shown in A and B. Note that patients with lower PATZ1 expression still have a worse OS and PFS survival rate compared to patients with higher PATZ1 expression, as assessed by Log Rank test (p < 0.01 and 0.05, respectively).
