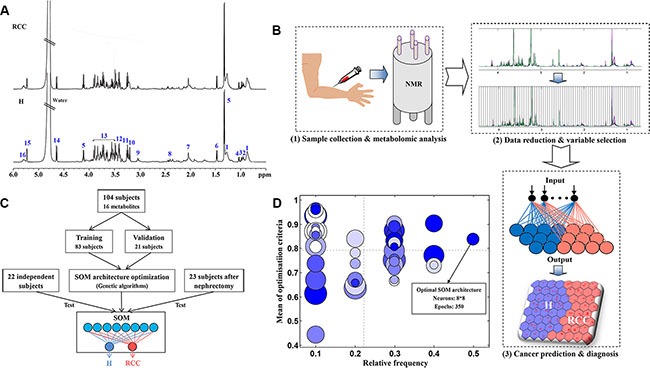
Figure 1. Development of the SOM model.

(A) The 1H NMR spectra from human serum samples used for the development of the SOM. The numbers correspond to the metabolites in Table S1; (B) The procedure for RCC prediction and diagnosis using the SOM: (1) sample collection and metabolomics analysis, (2) data reduction and variable selection, and (3) cancer prediction and diagnosis. (C) The development of the SOM. First, the SOM architecture was optimized using genetic algorithms. Second, the optimized SOM was trained and validated using 80% and 20% of the subjects, respectively. Finally, 22 independent subjects were analyzed to further evaluate the trained SOM model, and 23 additional subjects analyzed to evaluate metabolic patterns after nephrectomy. (D) The bubble plot of SOM architecture optimization by genetic algorithms. Each bubble represents a type of SOM architecture. The size and color of the bubbles are proportional to the number of neurons and epochs in the SOM, respectively.
