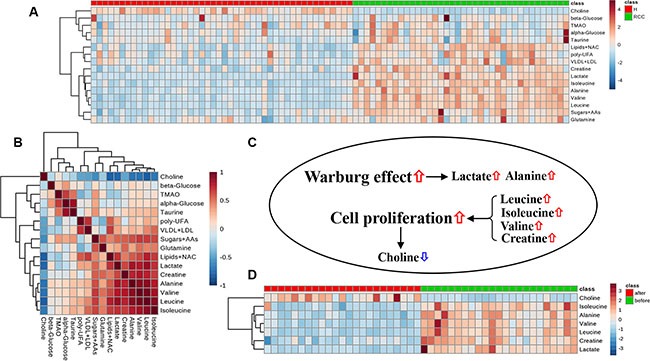
Figure 3. Metabolic data visualization.

Heatmap (A) and correlation (B) analyses of all 16 metabolites obtained from the NMR-based serum metabolome. Cluster analysis was performed using Ward's method and Euclidean distance. (C) Changes in metabolite levels in RCC patients and their biological effects in cancer cells. (D) Heat map analysis of seven metabolites as a biomarker cluster in RCC patients after nephrectomy.
